Laser beam melting of metals (LBM-M) [1] enables the manufacturing of complex parts, prototypes and small batch series. A sandblasted metal building platform is mounted inside a sealed chamber and metal powder is raked onto it. Then a laser melts the powder selectively according to a sliced CAD (computer aided design) model [5]. After a layer is finished the build platform is lowered, recoated with metal powder and the next layer is illuminated, densely connecting the neighboring layers [6]. Once the build job is completed, excess powder is removed manually from both the build platform and the parts, before the platform is extracted from the LBM machine. Depending on the material and the desired properties of the part a post processing route is applied. Aside from the automated build-up of the parts the process chain is performed manually.
Metal powders produced by inert gas atomization, contain alveolar as well as inhalable dust fractions [7] and may contain hazardous alloying elements. As Graff et al. mentioned in [8], the exposition to elements like cobalt and nickel [9] is assumed to be hazardous and carcinogenic [10] and nanoparticles or alveolar fractions of dust are well-known hazards in all metal processing technologies like grinding or welding. Possible disease patterns are pneumoconiosis and siderosis by regular inhalation or overload of iron particles [11]. As mentioned in [32] air pollution is the single largest environmental health risk in Europe and the disease burden resulting from air pollution is substantial. Heart disease and stroke, lung cancer, respiratory and cardiovascular diseases with both long and short term health effects are reported in the latest European Environmental Agency Report [31].
Therefore, a ventilation system is necessary in technologies with high particle or fine dust exposition rates due to the slow sedimentation of airborne fine particles as shown in Table 1 [12].
In order to quantify the exposure at the different steps along an exemplary process chain in LBM-M, measurements with optical particle counters (OPC) and filter based air samplers have been evaluated. The metal powders used during these measurements are the alumina alloy AlSi10Mg and the martensitic stainless steel 1.4542/X5CrNiCuNb.
Table 1: Estimation of the dependence of fall velocity and time on particle size for dust particles with a bulk density of 2 g/cm³ floating in air [12]
|
Fall velocity [cm/s] |
Fall time at 1 m height |
Particle diameter [µm] |
|
0,00006 |
500 h |
0,1 |
|
0,006 |
5 h |
1 |
|
0,6 |
3 min. |
10 |
|
15 |
6 sec. |
50 |
Only a few measurements concerning the safety and occupational exposure limits in AM have been published to date [33]. Graf et al. [8] showed filter-based measurements regarding the measured particle mass and chemical composition along a process chain with different materials, but without sufficient information about the technical ventilation system applied. Concerning the German technical rule for hazardous substances TRGS 402 [13] only the measurements published in [14] contain a punctual measurement for the build job removal.
We refer to the occupational exposure limits (OEL) listed in the technical rules for hazardous substances (TRGS) 900 [15]. For the acceptable (AK) and tolerable concentrations (TK) for carcinogenic, mutagenic, repro-toxic (CMR)-substances we refer to the TRGS 910 [16]. If there are no limits given yet, the German threshold limit value (MAK) and German biological threshold value (BAT) listed by the German Research Foundation (DFG) or other international limits (LIG) can be considered as required in TRGS 402 [13]. As mentioned in the introduction, CMR substances like nickel, cobalt, and chromium as well as their compounds are of special concern in LBM of metal powders. Exposure can result from direct contact to metal powder as well as welding fume residue [17] when cleaning a LBM machine TRGS 528 [18], TRGS 561 [10].
Here we describe the experimental situation as well as the measurement equipment. Together with the institute for occupational safety and health (IFA) of the German Social Accident Insurance (DGUV) we conducted the measurements with the filter based air sampling, the condensation particle counter measurements and the technical ventilation test. In a separate series of measurements with an aerosol spectrometer we analyze the same process steps in real-time.
The LBM manufacturing area consists of two rooms. The processing room with an estimated volume of 1000 m³ contains both LBM machines, as well as powder sieving stations, a powder recycling station and a band saw.
During preparation, the finished build platform is removed from the LBM machine. In order to prevent powder spread during extraction, excess dust is first removed inside the attached glovebox, then the building platform is wrapped in an antistatic bag. Afterwards, the glovebox and building chamber of the LBM machine are cleaned prior to inserting a new building platform. Via a supply valve, fresh metal powder is filled into the powder reservoir of the inert made LBM machine. Finally, the glovebox must be briefly opened to correctly adjust the powder coating blade. Preparation of the powder sieving stations is included into those measurements.
The main process is the laser beam melting of metal powder. During the post-processing, a powder recycling station is used to remove excess metal dust from the previously extracted and finished parts. A band saw containing a wet separator splits the finished parts from the building platform. Support structures are removed in an adjacent 84 m³ room to prevent powder spread and reduce noise. A wet separator with a movable focused nozzle accompanies manual procedures like clipping or grinding for a further reduction of airborne particles.
Technical ventilation and air conditioning ensures that all workplace measurements are performed at a constant room temperature of 23 °C. Furthermore, relative humidity is tracked and ranges from 64 to 74 %. Filtered fresh air is supplied in the middle of the ceiling. Air is removed through intakes on one side of the room near the bottom and under the ceiling. The LBM machines are 5 m away from the bottom intakes.
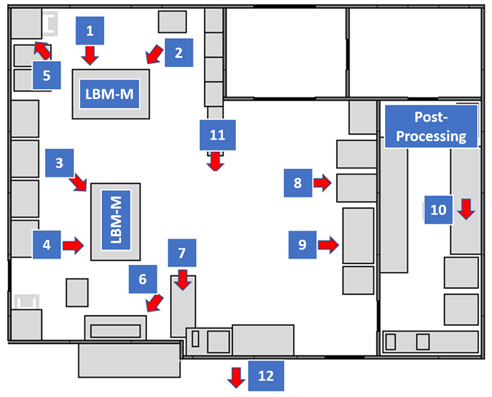

Figure 1: Drawing of the room and the measurement points. 1: Process Machine 1; 2: Preparation Machine 1; 3: Preparation Machine 2; 4 Process Machine 2; 5: Powder Sieving Station, 6: Powder Analysis 1; 7: Powder Analysis 2; 8: Powder Recycling & Heat Treatment; 9: Sawing; 10: Post-Processing Room; 11: Stationary Measurement Processing Room; 12: Stationary Measurement Outside
The tracer gas decay method as described in DIN EN ISO 12569 [19] and VDI 4300 page 7 [20] is used to quantify the actual air exchange rate in multiples of the room volume. Sulfur hexafluoride (SF6) is used as a tracer gas which is evenly distributed inside both rooms. Air samples are taken regularly over time inside both rooms as well as at the exhaust of the technical ventilation system for monitoring the decrease of the SF6 concentration. A gas-chromatograph calibrated to SF6 determines the concentration. Together with the volume of the room containing the laser beam melting machines of about 1000 m³ and the room for the post-processing of about 84 m³ a calculation has been performed following [21]. The technical ventilation system changes the volumetric equivalent of the bigger room 5,1 times per hour and that one of the smaller room 4,5 times per hour.
|
Size [µm] |
Grimm AS |
CDC |
GSP 10 (I) |
FSP 10 (R) |
|
|
Inhalable dust |
> 10 |
X |
- |
X |
- |
|
Respirable / alveolar dust |
< 10 |
X |
- |
- |
X |
|
Ultrafine dust |
< 0,1 |
- |
x |
- |
- |
Table 2: Comparison of the used dust detectors and the measurable dust size fraction [22].
Commonly two types of measurement techniques for the quantification of occupational expositions are differentiated. Those are discontinuous or collecting and continuous or real-time sampling methods. The inhalable and alveolar size fractions of airborne dust are collected on different filters and analyzed afterwards. Filter-based sampling enables the complete detection of all particles without upper limits due to a maximum sampling rate. The particle composition can be determined by chemical analysis of the collected dust [13].
For the following measurements, the SG10 Sampling Pump from GSA Messgerätebau GmbH is used in conjunction with GSP10 and FSP10 filter mounts. GSP10 is selective for detection of the inhalable dust fraction and the FSP10 is used for the alveolar dust fraction. This equipment allows for stationary as well as carried measurements. The sampling time for every measurement point lasted for at least for two hours at a flow rate of 10 L/min.
The metal-containing dusts were collected on cellulose nitrate filters with a pore width of 8.0 μm and a diameter of 37 mm. Depending on the substances the gravimetric determination of the alveolar and inhalable fraction was carried out before or after the quantitative analysis of the metals and their compounds. The metal concentrations contained in the deposited dust and their inorganic compounds were quantified by ICP mass spectrometry (ICP-MS) or X-ray fluorescence spectrometry (TRFA) as multi-element analyzes. Measurements below the determination limit were documented by their individual determination limit. This is mainly dependent on the analytical method and sample volume (volume flow and sampling time). The methods are suitable for measurements according to TRGS 402 [13] and meet the requirements of DIN EN 482 [23] and DIN EN 13890 [24].
Sampling of chromium (VI) compounds was performed in the inhalable fraction on a 37 mm quartz fiber filter. The chromium (VI) compounds are dissolved from the filter by means of an alkaline mixture. The UV spectrometric determination was carried out after acidification with acid and derivatization with diphenylcarbazide. The process is specific for chromium (VI) compounds.
The used optical particle counter (OPC) is produced by the Grimm Aerosol Technik GmbH & Co. KG, Ainring, Germany. It uses light scattering by particles and a laser source at 780 nm to count the concentration of dust particles with 15 size channels in the range of 0.3-20 µm.
Optical particle counters are used under several simplifications as mentioned in DIN 33899-1 & -2 [25] [26]: The aerosol used for the calibration of the device has the same optical properties as the measured substances. All detected particles are spherical and have the same density. The throughput of the used pump is constant and well known. Due to the light scattering technique a maximum sampling rate is limiting the number of measurable particles. Additionally, no chemical analysis is possible since the particles are not collected. The detected absolute number of particles of the Grimm aerosol spectrometer is only an estimated value and has a variance of up to 20 % at high particle concentrations, as shown in [27] and [28].
Advantages of real-time samplers are the time resolution and the possibility to detect sources of dust emissions. This is beneficial in order to detect specific movements or process steps as possible sources of dust emissions.
The probe of the aerosol spectrometer is 142 cm above the ground, which is equal to the height of filter mounts during the filter-based measurements. Apart from the detection of the background exposure in the middle of the processing room, the probe is located 50 cm away from the most likely metal powder source. Prior to each measurement of a process step, the background exposure in the middle of the processing room is detected. The background exposure varies daily in accordance with the airborne particulate matter of the surrounding air outside of the processing room.
The condensation particle counter CPC 3007 from TSI is used for the detection of ultrafine particles during selected process steps, covering a particle size range of 0.01-1 µm. Up to 100000 particles/cm³ can be detected. The measurements performed at last for at least 10 minutes and 50 cm away from the most likely concentration of powder [29].
During the measurements one LBM machine was processing the aluminum alloy AlSi10Mg, and the other was processing stainless steel 1.4542. The grain size distribution is measured by laser diffraction using a Mastersizer 2000 of the company Malvern Instruments Ltd (see Table 3, Figure 2).
Table 3: d10, d50 and d90 values for the cumulative volumetric fractions of the grain size distributions of the used AlSi10Mg and the stainless steel powder.
|
Volumetric Fractions [%] |
d10 |
d50 |
d90 |
|
AlSi10Mg [µm] |
14,48 |
27,91 |
49,29 |
|
1.4542 [µm] |
24,39 |
34,43 |
49,54 |
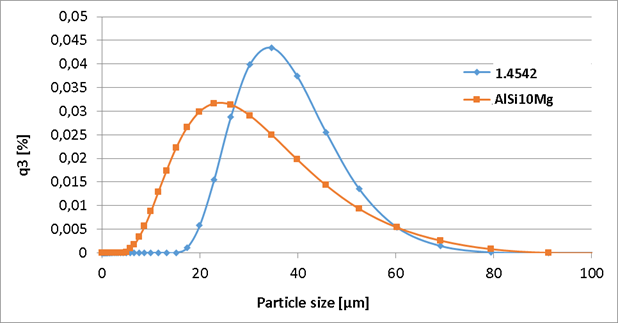

Figure 2: Particle size distribution of the used powders, measured by laser diffraction.
The delivered powder was tested in an external laboratory and the stated composition of the supplier is inside the range given in Table 4. Carcinogenic, mutagenic and reprotoxic (CMR-) substances are highlighted. Table 4 includes the nickel-base alloy Inconel 718, the stainless steel 1.4404, and the tool-steel 1.2709 because of the high nickel-, chromium- or cobalt- content and the frequent usage of the materials in the AM industry.
Table 4: Chemical composition of various metal powders commonly used in the LBM process. The materials used during this study do not contain a high percentage of the elements cobalt, nickel or chromium, known to be hazardous. For comparison the materials 1.2709 and IN718 are shown here since they are commonly used in metal AM.
|
Chemical Elements |
AlSi10Mg |
1.4404 |
1.4542 |
1.2709 |
IN718 |
|
Aluminum |
Balance |
0,2 – 0,8 |
|||
|
Boron |
≤ 0,006 |
||||
|
Carbon |
0 – 0,05 |
0 – 0,03 |
0 – 0,07 |
≤ 0,03 |
≤ 0,08 |
|
Chromium |
16,5 – 18,5 |
15,0 – 17,5 |
≤ 0,25 |
17,0 – 21,0 |
|
|
Cobalt |
8,50 – 10,0 |
≤ 1,0 |
|||
|
Copper |
0 – 0,10 |
3,0 – 5,0 |
≤ 0,3 |
||
|
Iron |
0 – 0,55 |
Balance |
Balance |
Balance |
Balance |
|
Lead |
0 – 0,05 |
||||
|
Magnesium |
0,20 – 0,45 |
||||
|
Manganese |
0 – 0,45 |
0 – 2,0 |
0 – 1,0 |
≤ 0,15 |
≤ 0,35 |
|
Molybdenum |
2,0 – 2,5 |
4,5 – 5,2 |
2,8 – 3,3 |
||
|
Nickel |
0 – 0,05 |
10,0 – 13,0 |
3,0 – 5,0 |
17,0 – 19,0 |
50,0 – 55,0 |
|
Niobium |
0,15 – 0,45 |
4,75 – 5,5 |
|||
|
Phosphorus |
≤ 0,015 |
||||
|
Platinum |
0 – 0,045 |
0 – 0,04 |
≤ 0,010 |
||
|
Silicon |
9,0 – 11,0 |
0 – 1,0 |
0 – 1,0 |
≤ 0,10 |
≤ 0,35 |
|
Sulfur |
0 – 0,03 |
0 – 0,03 |
≤ 0,010 |
≤0,015 |
|
|
Tantalum |
0,15 – 0,45 |
||||
|
Tin |
0 – 0,05 |
||||
|
Titanium |
0 – 0,15 |
0,80 – 1,20 |
0,65 – 1,15 |
||
|
Zinc |
0 – 0,10 |
At first, the results of the filter-based measurements conducted in cooperation with the IFA are shown. The results of the real-time measurement series were performed separately with the aerosol spectrometer.
Filter-based measurements are conducted with carried as well as stationary measurement equipment described in 3.3. The filter mounts for carried measurements are located at shoulder height to collect air near the breathing zone of the worker. The background exposure is determined by a stationary measurement in the middle of the main processing room, about 4 m away from the gloveboxes of each LBM machine and about 10 m away from the air intakes of the technical ventilation. To check the sealing of each LBM machine, a stationary measurement is conducted in front of the LBM process chamber during printing with the filter mounts located at shoulder height, 50 cm away from the LBM process chamber (see Figure 3: Filter-based measurement in front of the process chamber. The stationary measurement is conducted with a tripod at 1,42 m height and at a distance of 0,5 m in front of the process chamber of the Laser beam melting machine during operation.).
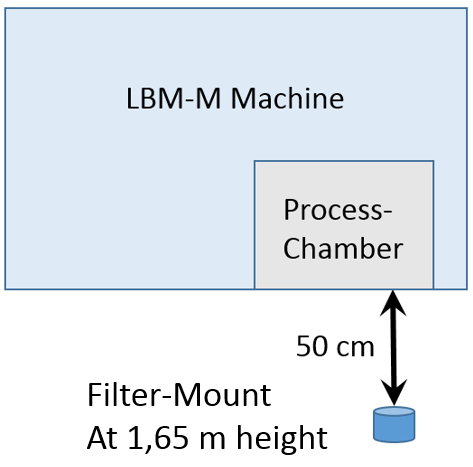

Figure 3: Filter-based measurement in front of the process chamber. The stationary measurement is conducted with a tripod at 1,42 m height and at a distance of 0,5 m in front of the process chamber of the Laser beam melting machine during operation.
At first, we show the stationary measurements inside the process room. Only those elements are shown, that are above the limit of determination. The occupational exposure limits (OEL) are according to German TRGS 900 [15], TRGS 910 [16] and TRGS 561 [10] (draft July 2017). When no official material specific OEL is given for the corresponding dust size fraction, the cell in the following tables is left blank and the measured values are assessed according to the German general dust limit (ASGW) with 10 mg/m³ for the inhalable fraction and 1,25 mg/m³ for the alveolar fraction [15]. Next, the results of the measurements of the stainless steel route are presented, followed by the aluminum route. The time needed for the different steps are less than 3 hours for the preparation, less than 4 hours for the post process, and less than 3 hours for the thorough cleaning of the whole LBM machine. For all measurements performed no chromium VI has been detected.
At first, we show the results of the filter-based stationary measurements in the middle of the process room in Table 5 compared to the occupational exposure limits described above. These results show the background exposure in the processing room.
|
Chem. Elements |
Measured value [mg / m³] |
OEL [mg / m³] |
|
Aluminum a.i.c. (I) |
0,0017 |
|
|
Chromium a.i.c. (I) |
0,000096 |
2 (I) |
|
Iron a.i.c. (I) |
0,00062 |
Table 5: Results of the stationary measurement in the middle of the processing room compared to the occupational exposure limits (OEL) TRGS 900 [15], TRGS 910 [16], TRGS 561 [10]
The background measurements show low concentrations of aluminum, chromium or iron particles in the lower microgram regime.
The results and comparisons for the stainless steel process route are shown in Table 6 and those for AlSi10Mg powder processing machine in Table 7. With the above stated duration of each process step, every measured value is well within occupational exposure limits. The highest exposure was detected during the cleaning of the stainless steel processing LBM machine, which is necessary when service tasks are due or the type of metal powder is changed. With the given duration of the thorough cleaning process, such a cleaning is limited to once daily, else the OEL is exceeded.
|
Pre-Process (carried) |
Measured value [mg / m³] |
OEL [mg / m³] |
|
Chromium a.i.c. (A/I) |
0,00061 / 0,011 |
2 (I) |
|
Iron a.i.c. (A/I) |
0,0024 / 0,052 |
|
|
Copper a.i.c. (I) |
0,0033 |
|
|
Nickel a.i.c. (A) |
0,00073 |
0,006 (TK & AK) |
|
Process (Stationary) |
||
|
Copper a.i.c. (I) |
0,00063 |
|
|
Post-Process (carried) |
||
|
Chromium a.i.c. (A/I) |
0,00029 / 0,001 |
2 (I) |
|
Iron a.i.c. (A/I) |
0,0014 / 0,0053 |
|
|
Copper a.i.c. (A) |
0,0061 |
|
|
Nickel a.i.c. (I) |
0,00054 |
|
|
Cleaning (carried) |
||
|
Inhalable dust |
5,32 |
10 (ASGW) |
|
Chromium a.i.c. (A/I) |
0,00031 / 0,28 |
2 (I) |
|
Iron a.i.c. (I) |
1,3 |
|
|
Copper a.i.c. (I) |
0,064 |
|
|
Nickel a.i.c. (I) |
0,089 |
Table 6: Results of stainless steel route compared to the occupational exposure limits (OEL). A denotes the alveolar and I the inhalable amount of the dust TRGS 900 [15], TRGS 910 [16], TRGS 561 [10]
|
Pre-Process (carried) |
Measured value [mg / m³] |
OEL [mg / m³] |
|
Inhalable dust |
0,92 |
10 (ASGW) |
|
Aluminum a.i.c. (A/I) |
0,049 / 0,470 |
|
|
Process (stationary) |
||
|
Aluminum a.i.c. (I) |
0,00078 |
|
|
Post-Process(carried) |
||
|
Aluminum a.i.c. (A/I) |
0,0045 / 0,079 |
|
|
Cleaning (carried) |
||
|
Inhalable dust |
0,72 |
10 (ASGW) |
|
Aluminum a.i.c. (A/I) |
0,018 / 0,490 |
Table 7: Results of the alumina alloy powder processing route compared to the occupational exposure limits (OEL) extracted as described above. A denotes the alveolar and I the inhalable amount of the dust fraction. TRGS 900 [15], TRGS 910 [16], TRGS 561 [10]
The aluminum pre-process shows a higher and measurable amount of inhalable dust. Due to the lower density of aluminum powder (2,7 g/cm³) compared to the stainless steel powder (7,8 g/m³) a higher dust concentration is plausible due to dust dispersion and a slower sedimentation during the refill process. During the process we observed the same order of magnitude for the dust concentrations that is comparable to the fine dust measurements above. The results of the post processing indicate a disproportionally high amount of copper compared to the chemical composition of the stainless steel. This may be supported by the copper precipitation hardening process of the stainless steel 1.4542 (17-4 PH).
Ultrafine particles have been measured in order to compare the maximum, minimum and average values inside the process room with the environment in front of the sealed process room. In case of the post-processing step it is clear that manually performed mechanical works result in high concentration of particles in the air.
|
Real time measurement |
Minimal value [particles / cm³] |
Average value [particles / cm³] |
Maximal value [particles / cm³] |
|
Basic load inside the process room |
3653 |
4622 |
5686 |
|
Basic load outside the process room |
6584 |
16485 |
19922 |
|
Process room during the processing of AlSi10Mg |
4543 |
6443 |
9292 |
|
Pre-Process (stainless steel) |
2108 |
2934 |
3517 |
|
Post-Process (stainless steel) |
3712 |
49301 |
113331 |
|
Examples of different working environments |
Total concentration [particles / cm³] |
Maximum of the distribution [nm] |
|
|
Metal grinding |
100.000 |
280-520 |
|
|
Bakery |
640.000 |
32-109 |
|
|
Welding |
100.000-4.000.000 |
40-600 |
Table 8: Direct showing measurement of ultrafine dust particles: Comparison of the environment outside and inside the processing room, post processing peaks and examples of different environments [30]
This section contains the results of the optical particle counter real-time measurements. Background exposure has been measured as explained above and is shown in the following graphs as an orange line for comparison. Figure 4 shows the course of the particle concentration during the preparation of the LBM machine. During phase one new powder is filled into the machine. This process is performed inside the closed glovebox and does not exhibit higher dust emissions. During phase two the glovebox of the LBM machine is cleaned. Phase three depicts the alignment of the scraper and the coating of the first powder layer. Of course, this step is performed with a closed machine as well and does not show any noticeable emissions.
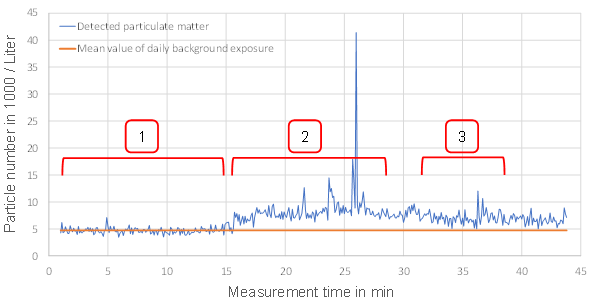

Figure 4: Course of the detected airborne particulate matter (blue) compared to the mean value of the daily background exposure (orange) during the preparation of the LBM machine. Phase 1 – loading of fresh metal powder, phase 2 – cleaning of the glovebox, phase 3 – Alignment of the powder coating blade as well as coating of first powder layer
Figure 5 shows the results of the stationary measurement in front of the process chamber of the LBM machine during build-up. No noticeable difference to the background exposure can be detected. This confirms a correct sealing of the process chamber.
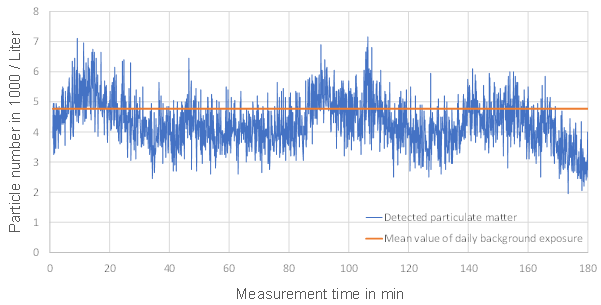

Figure 5: Course of the detected airborne particulate matter (blue) compared to the mean value of the daily background exposure (orange) during the build-up in the process chamber of the LBM machine.
Figure 6 shows the extraction of the building platform with the finished parts. In this example, all intermediate steps are performed while the cover of the glovebox is open. In the first phase excess metal powder is removed as well as the glovebox is cleaned. During phase two the building platform is wrapped in an antistatic bag. The bag is then removed from the glovebox in phase 3.
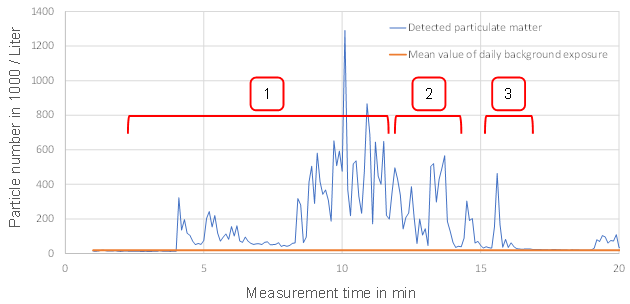

Figure 6: Course of the detected airborne particulate matter (blue) compared to the mean value of the daily background exposure (orange) during the extraction of the building platform with the finished parts from the LBM machine. All intermediate steps are performed with opened glovebox. Phase 1- removal of excess powder from building platform, phase 2 – building platform is wrapped in antistatic bag, phase 3 – bag is removed from glovebox
Figure 7 shows the extraction of the building platform from the LBM machine with a closed glovebox. This time, all intermediate steps up to the removal of the bag in phase three are performed. The amount of released metal particles is drastically reduced as well as the exposure time shortened.
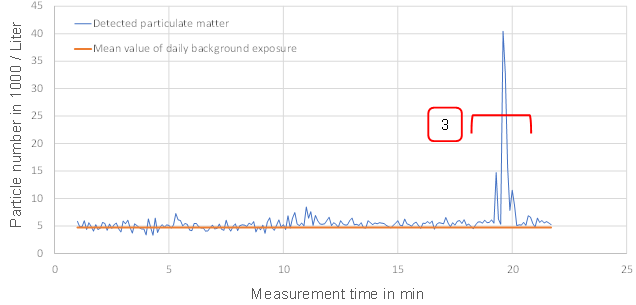

Figure 7: Course of the detected airborne particulate matter (blue) compared to the mean value of the daily background exposure (orange) during the extraction of the building platform with the finished parts from the LBM machine. This time, all intermediate steps are performed with closed glovebox cover. Phase 3 – bag is removed from glovebox.
In Figure 8 the manual removal of support structures is depicted. Two major phases can be determined. Phase one shows no discernible difference compared to the background exposure. During this phase, support structures are removed for example by clipping, while a wet separator with a movable vacuum nozzle removes released metal powder. Residues of support structures are removed using a grinder during phase two. Although the wet separator is still used, the focused vacuum nozzle cannot remove all emitted particulate matter. This results in a sharp increase in detected airborne particles.
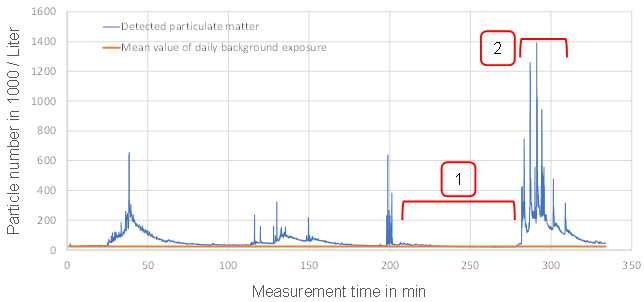

Figure 8: Course of the detected airborne particulate matter (blue) compared to the mean value of the daily background exposure (orange) during the manual removal of support structures during post process. Phase 1 – removal of support structures by clipping or breaking off, phase 2 – removal of support structures by grinding.
Figure 9 is a superposition of the previously shown courses of detected airborne particulate matter to allow an easier comparison. Additionally, a wet grinding process in the machining area of the facility is presented as a comparison.
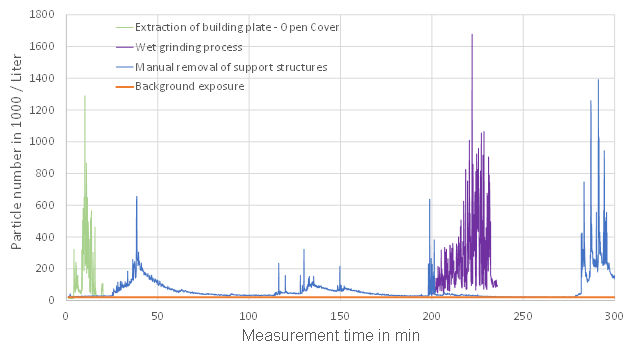

Figure 9: Superposition of selected steps of the LBM process chain. Depicted is the source of the detected airborne particulate matter (green, blue) compared to the mean value of the daily background exposure (orange). Additionally, a wet grinding process (violet) is presented as a comparison. The preparation of the LBM machine, the build-up process and the extraction of finished parts with closed glovebox have been omitted due to their low particle count.
Metal dust in different fractions is known to be hazardous and some of the typically alloys contain high percentages of CMR-substances like nickel and cobalt. We conducted two series of experiments for the detection of risk factors along an exemplary process chain of LBM-M. The materials used are AlSi10Mg and the stainless steel 1.4542. The filter-based measurements allowed a determination of the chemical composition and mass of the detected dust fractions and are compliant with the existing national rules in Germany TRGS 402 [13]. The real-time measurements with an optical particle counter allowed a qualitative exposure analysis during processing steps. The observed loads at all steps are beneath the German occupational safety limits. But significant emissions are observed at several process steps: Cleaning of the machinery, powder refill, building platform removal, and post processing with manual tools. Many materials used in LBM contain higher concentrations of hazardous elements or CMR-substances, like the tooling steel 1.2709 or the alloy Inconel 718. Therefore, we recommend a higher degree of automation and powder containment along the process chain. Exposure time should be reduced to a minimum and respirators and personal safety equipment is mandatory if no technical or organizational prevention is possible.
The authors wish to acknowledge the Federal Ministry of Education and Research by the funding of the Erlangen Graduate School in Advanced Optical Technologies (SAOT) by the German Research Foundation (DFG) in the framework of the German excellence initiative for the financial support of the project. Special thanks go to the company ULT AG for their support and consultation. We would like to thank Mrs. Pitzke and the IFA of the DGUV for the cooperation and we point out that further measurement results are going to be published by the IFA as part of a round robin experimental series. Finally, we would like to mention the guidelines work of the technical committee 105.6 for the safety in working with additive production machinery of the Association of German Engineers (VDI e.V.) which helped to make our measurements possible.
Gebhardt, Andreas, Additive Fertigungsverfahren: Additive Manufacturing und 3D-Drucken für Prototyping-Tooling-Produktion. Carl Hanser Verlag GmbH Co KG, 2016
Verein Deutscher Ingenieure: Fachausschuss 105.6 – Sicherheit beim Betrieb additiver Fertigungsanlagen, Website: https://www.vdi.de/technik/fachthemen/produkt-und-prozessgestaltung/artikel/sicherheit-beim-betrieb-additiver-fertigungsanlagen/, Last visited 20.09.2017
International Organization for Standardization: ISO/TC 261/AHG 2 – AM safety issues, Website: https://www.iso.org/committee/629086.html, Last visited 20.09.2017
ASTM F42.06 – WK59813 – New guide for Hazard Risk Ranking and Safety Defense, Website: https://www.astm.org/DATABASE.CART/WORKITEMS/WK59813.htm , Last visited 20.09.2017
Schmidt, Michael, et al. "Laser based additive manufacturing in industry and academia." CIRP Annals-Manufacturing Technology 66.2 (2017): 561-583.
Meiners, W., et al. "Direct generation of metal parts and tools by selective laser powder remelting (SLPR)." Proceedings of SFF, Austin, Texas (1999).
Cooke, April, and John Slotwinski. Properties of metal powders for additive manufacturing: a review of the state of the art of metal powder property testing. US Department of Commerce, National Institute of Standards and Technology, 2012.
Graff, Pål, et al. "Evaluating measuring techniques for occupational exposure during additive manufacturing of metals: A pilot study." Journal of Industrial Ecology (2016).
Kelly, Frank J., and Julia C. Fussell. "Health Effects of Airborne Particles in Relation to Composition, Size and Source." Airborne Particulate Matter. Royal Society of Chemistry, 2016. 344-382
Bundesanstalt für Arbeitsschutz und Arbeitsmedizin: Technische Regel für Gefahrstoffe TRGS 561 – Tätigkeiten mit krebserzeugenden Metallen und ihren Verbindungen, Draft July 2017
European Respiratory Journal, 2015 46: PA11156, DOI: 10.1183/13993003.congress-2015.PA1156, Marian Quanjel, Bart Luijk, Aryan Vink, H. Stigter, Jos Rooijackers, “Pulmonary siderosis as a cause of systemic iron overload”.
Sicheres Arbeiten mit Gefahrstoffen von Birgit Stöffler, 2. Auflage, ecomed SICHERHEIT, ecomed-Storck GmbH, Landsberg am Lech, 2017
Bundesanstalt für Arbeitsschutz und Arbeitsmedizin: Technische Regel für Gefahrstoffe TRGS 402 – Ermitteln und Beurteilen der Gefährdungen bei Tätigkeiten mit Gefahrstoffen: Inhalative Exposition (Technical Rules for Hazardous Substances – Identification and assessment of the risk from activities involving hazardous substances: inhalation exposure). Committee on Hazardous Substances – AGS (eds.) Federal Ministry of Labor and Social Affairs, last amended by GMBI 2016 pp. 843-846 (no. 43) (2016).
Dominik Schmid, Christoph Schmutzler, Sandra Schreiber, Christine Anstätt, Michael F. Zäh, „Occupational Safety in powder-bed based Additive Manufacturing”, Proceedings of the 13th Rapid.Tech Conference Erfurt, Germany 2016
Bundesanstalt für Arbeitsschutz und Arbeitsmedizin: Technische Regel für Gefahstoffe TRGS 900 – Arbeitsplatzgrenzwerte (Technical Rules for Hazardous Substances – Occupational Exposure Limits). Committee on Hazardous Substances – AGS (eds.) Federal Ministry of Labor and Social Affairs, last amended by GMBI 2016 pp. 886-889 (no. 45) (2016).
Bundesanstalt für Arbeitsschutz und Arbeitsmedizin: Technische Regel für Gefahrstoffe TRGS 910 – Risikobezogenes Maßnahmenkonzept für Tätigkeiten mit krebserzeugenden Gefahrstoffen (Technical Rules for Hazardous Substances – Risk-related concept of measures for activities involving carcinogenic hazardous substances). Committee on Hazardous Substances – AGS (eds.) Federal Ministry of Labor and Social Affairs, last amended by GMBI 2016 pp. 606-609 (no. 31), corrected by GMBI. 2016 p. 791 (no. 40) (2014).
Deutsche Gesetzliche Unfallversicherung: DGUV Information 209-020 – Beurteilung der Gefährdung durch Schweißrauch (bisher BGI 616), Vereinigung der Metall-Berufsgenossenschaften, 2005
Bundesanstalt für Arbeitsschutz und Arbeitsmedizin: Technische Regel für Gefahrstoffe TRGS 528 – Schweißtechnische Arbeiten, 2009
Deutsche Industrienorm: DIN EN ISO 12569 – Wärmetechnisches Verhalten von Gebäuden und Werkstoffen – Bestimmung des spezifischen Luftvolumenstroms in Gebäuden – Indikatorgasverfahren, Beuth Verlag, 2013
Verein Deutscher Ingenieure: VDI 4300 – Blatt 7 – Messen von Innenraumluftverunreinigungen – Bestimmung der Luftwechselzahl in Innenräumen, Beuth Verlag, 2001
Institut für Arbeitsschutz: Bestimmung des Luftwechsels in Innenräumen, Website: http://publikationen.dguv.de/dguv/pdf/10002/aifa0324.pdf , Last visited 25.07.2017
Deutsche Industrienorm: DIN EN 481 – Arbeitsplatzatmosphäre – Festlegung der Teilchengrößenverteilung zur Messung luftgetragener Partikel, Beuth Verlag, 1993
DIN EN 482: Arbeitsplatzatmophäre – Allgemeine Anforderungen an die Leistungsfähigkeit von Verfahren zur Messung chemischer Arbeitsstoffe. Berlin Beuth 2015
Deutsche Industrienorm: DIN EN 13890 – Exposition am Arbeitsplatz – Messung von Metallen und Metalloiden in luftgetragenen Partikeln – Anforderungen und Prüfverfahren, Beuth Verlag, 2010
Deutsche Industrienorm: DIN 33899-1 – Exposition am Arbeitsplatz – Leitfaden für die Anwendung direkt anzeigender Geräte zur Überwachung von Aerosolen – Teil 1: Auswahl des Monitors für besondere Anwendungsfälle, Beuth Verlag, 2014
Deutsche Industrienorm: DIN 33899-2 – Exposition am Arbeitsplatz – Leitfaden für die Anwendung direkt anzeigender Geräte zur Überwachung von Aerosolen – Teil 2: Ermittlung der Konzentration luftgetragener Partikel mit optischen Partikelzählern, Beuth Verlag, 2014
Burkart, J.; Steiner, G.; Reischl, G.; Moshammer, H.; Neuberger, M.; Hitzenberger, R.: Characterizing the performance of two optical particle counters (Grimm OPC 1.108 and OPC 1.109) under urban aerosol conditions, In: Journal of Aerosol Science 41, 2010, pp 953 – 962
Cheng, Y.: Comparison of the TSI Model 8520 and Grimm Series 1.108 Portable Aerosol Instruments Used to Monitor Particulate Matter in an Iron Foundry, In: Journal of Occupational and Environmental Hygiene, Band 5, Ausgabe 3, 2008, pp 157 – 168
Matson, U; Ekberg, L. E.; Afshari, A.: Measurement of Ultrafine Particles: A Comparison of Two Handheld Condensation Particle Counters, In: Aerosol Science and Technology, Volume 38, Issue 5, 2004, pp 487-495
Deutsche Gesetzliche Unfallversicherung: Vorkommen von ultrafeinen Aerosolen an Arbeitsplätzen, Website: http://www.dguv.de/medien/ifa/de/pub/grl/pdf/2005_196.pdf , Last visited 25.07.2017
Air Quality in Europe, European Environmental Agency Report Number 13 / 2017, ISSN 1977-8449
Lim, S. S., Vos, T., Flaxman, A. D., Danaei, G., Shibuya, K., Adair-Rohani, H., ... & Aryee, M. (2012). A comparative risk assessment of burden of disease and injury attributable to 67 risk factors and risk factor clusters in 21 regions, 1990–2010: a systematic analysis for the Global Burden of Disease Study 2010. The lancet, 380(9859), 2224-2260.
S. Kaierle, A. Baumgärtel, M. Gieseke, J. Walter; M. Hustedt, Additive Fertgiung, aber sicher - Aktueller Stand der Arbeitssicherheit bei der addi-tiven Fertigung, Rapid. Tech–International Trade Show & Conference for Additive Manufacturing: Proceedings of the 13th Rapid. Tech Conference Erfurt, Germany, 14–16 June 2016. Carl Hanser Verlag GmbH Co KG, 2016
M.Sc. Tobias Kolb
Friedrich-Alexander-University Erlangen-Nürnberg (FAU)
Institute of Photonic Technologies
Konrad-Zuse-Str. 3/5
91052 Erlangen
E-Mail:
tobias.kolb@lpt.uni-erlangen.de
WEB:
www.lpt.techfak.uni-erlangen.de/
B.Sc. Philip Schmidt
Friedrich-Alexander-University Erlangen-Nürnberg (FAU)
Institute of Photonic Technologies
Konrad-Zuse-Str. 3/5
91052 Erlangen
E-Mail:
Philip.Schmidt@fau.de
WEB:
www.lpt.techfak.uni-erlangen.de/
Dr. Renate Beisser
Institute for Occupational Safety and Health (IFA)
of the German Social Accident Insurance (DGUV)
Alte Heerstr. 111
53757 Sankt Augustin
E-Mail:
renate.beisser@dguv.de
WEB: www.
http://www.dguv.de/ifa
Dr.-Ing. Jan Tremel
Robert Bosch GmbH
Center of Competence 3D-Printing (GS/MFT-3DP)
Zweibrückener Straße 13
90441 Nürnberg
E-Mail:
jan.tremel@de.bosch.com
WEB:
www.bosch.com
Prof. Dr.-Ing. Michael Schmidt
Friedrich-Alexander-University Erlangen-Nürnberg (FAU)
Institute of Photonic Technologies
Konrad-Zuse-Str. 3/5
91052 Erlangen
E-Mail:
Michael.Schmidt@lpt.uni-erlangen.de
WEB:
www.lpt.techfak.uni-erlangen.de/