Untitled Document
© 2016 Harald Rieper; Lizenznehmer RTejournal, weitere Informationen sind zu finden unter: http://www.dipp.nrw.de/service/dppl/
urn:nbn:de:0009-2-44141
Additive Manufacturing is a collection of emerging production methods for the direct manufacturing of ready-made parts. Powder based systems such as Selective Laser Melting (SLM) are appropriate methods for generating complex shapes layer by layer. At the beginning, the method was mainly used for the manufacturing of prototypes, later for the manufacturing of tools, and nowadays, functional parts can be processed (Gibson et al., 2010).
The increasing popularity of these systems is based on economic reasons since the costs for tools and excessive machining can be saved. Furthermore, for conventional manufacturing processes, the costs of lightweight structures in general increase with increasing weight-reduction. But if the structures are manufactured with powder based systems, the costs may decrease if a significant amount of powder can be saved. Literature and current research only partly cover the need for the qualification of different materials since little is known about the processing of many alloys and materials using selective laser melting. From the authors’ knowledge, the eutectic silver copper alloy Ag 28 wt. % Cu is a technical material that has not been sufficiently investigated prior to this study.
The number of successfully processed materials using the selective laser melting technology increases every year. In 1999, single metal component materials in general were reported (Meiners, 1999). Titanium and tool steel were analyzed within a few years thereafter (Over, 2003). In order to achieve high densities, an iron based mixture with Ni, Cu, and Fe3P powders was analyzed (Kruth et al., 2004). Waspaloy®, a nickel based mixture with Co, Cr, Mo, Fe, Si, Mn, Al, Ti and Cu was processed (Mumtaz et al., 2008). For precious materials, gold has been processed (Khan and Dickens, 2010). Parts out of a tungsten-copper alloy have also been produced (Li et al., 2010a). The manufacturing of tensile tests from stainless steel grades AISI 316L have also been reported (Tolosa et al., 2010). The behavior of nickel based iron and copper powders were also analyzed (Tolochko et al., 2003). In this work, findings of the author’s dissertation have been used. (Rieper, 2013)
AgCu has a binary phase diagram. Pure silver melts at a temperature of 961.78°C, whereas pure copper melts at a temperature of 1084.62°C (Hammond, 2003). Figure 1 shows that the melting point of the eutectic is at 779°C (Kattner, 2003). The eutectic point is important since there is no separation between the liquidus and solidus lines since below 779°C all material will be solid and above 779°C all material will be liquid. Depending on the literature source, the maximum solubility of copper in silver and of silver in copper deviates, but occurs at a temperature of 779°C (Hansen, 1958). The maximum solubility of Ag in Cu is approx. 8.8 wt. % Ag, whereas the maximum solubility of Cu in Ag is approx. 8.2 wt. % Cu (Hansen, 1958).
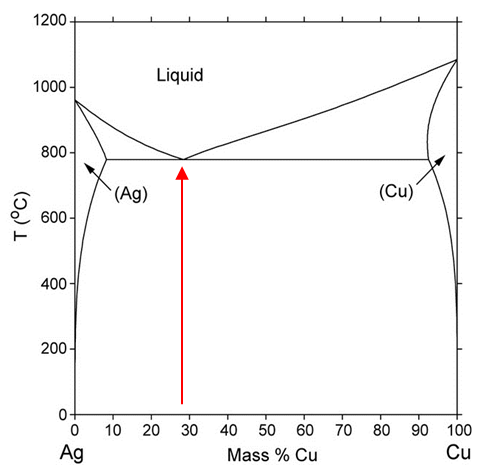
Figure 1: Alloy phase diagram system for AgCu (Kattner, 2003)
AgCu 7.5 is known as sterling silver. Texture investigations on sterling silver were conducted by (Gartner, 1970), The investigations were related to rolling processes and not to additive manufacturing. A silver–copper alloy that is comparable to sterling silver was processed using selective laser melting by (Gebhardt et al., 2012a) in order to investigate lightweight structures. Further research targeted the optimization of scan strategies and parameter fields (Gebhardt et al., 2012b). In his dissertation, (Gaganov, 2010) analyzed mechanical and electrical properties for different AgCu contact materials, but the research was not related to additive manufacturing methods. The eutectic material at a Cu mass percentage of 28% is used for brazing and as a contact material. (Vinaricky, 2009) noted that AgCu28 is used as a contact material for weld contacts, layer contacts, riveted contacts and plated contacts.
(Zhao et al., 2009) used AgCu28 as filler material for vacuum brazing of NiTi strips, but the research covered a different manufacturing method.
Figure 2 shows a detailed schematic of the Selective Laser Melting process. As the general process by which SLM builds parts is well-known in the literature, it will not be described in detail here. In the case of the Realizer SLM 50 desktop machine, a wiper blade which rotates around an axis is used to distribute powder. The wiper blades, which can be lowered and lifted, contain powder which is poured between the blades either manually or via an automated screw feeder. Surplus powder is wiped to the powder overflow (Figure 2, item 6).
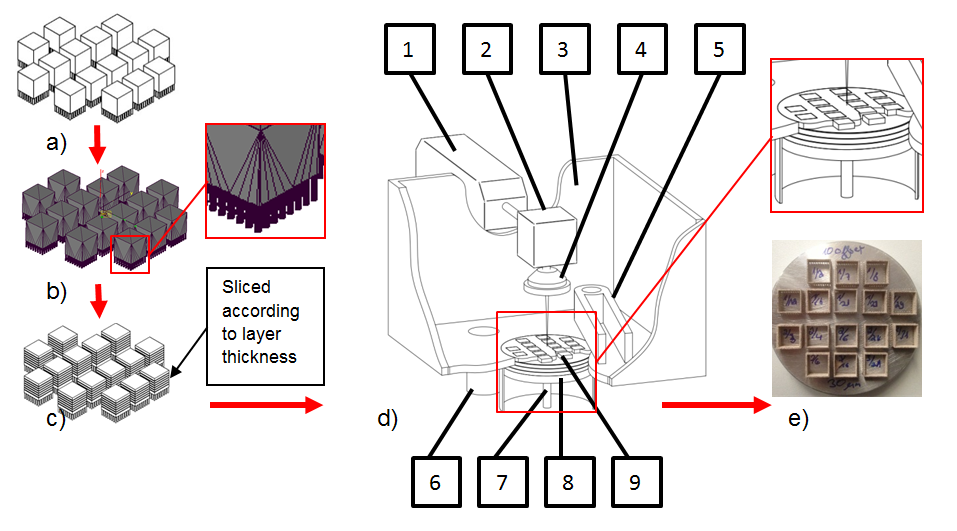
Figure 2: Process of Selective Laser Melting - a) 3D-CAD file, b) STL file, c) Sliced file, d) Scheme of SLM machine, consisting of: 1) Laser source 2) XY-Scanner 3) Processing chamber 4) F-Theta lens 5) Double-bladed recoating unit and powder feeder 6) Powder overflow 7) Adjustable piston 8) Work pieces, previous layers, embedded in powder, 9) Work pieces, current layer e) Base plate with manufactured samples
A eutectic powder was specially manufactured for this test series using a gas atomizer by TLS Technik GmbH & Co. Spezialpulver KG). A rotating electrode was melted using induction heating. The droplets of liquid metal were cooled down in an inert spray chamber in order to achieve spherical particles (TLS Technik GmbH & Co. Spezialpulver KG, 2012).
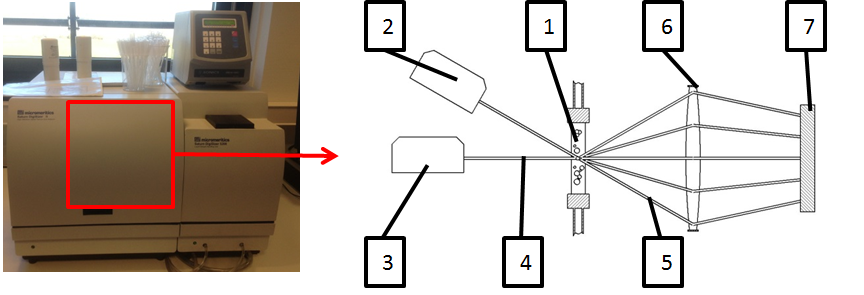
Figure 3: Process of laser fraction method, machinery and test scheme 1) Specimen dispersion in test tube, 2) and 3) Laser source, adjusted under different angles 4) Laser beam, not scattered, 5) Scattered laser beams, 6) Collection lens, 7) CCD Detector (Adapted from (Micromeritics Instrument Corporation, 2013)).
The particle diameter distribution was analyzed using the laser scattering method. A dispersion of AgCu28 in natrium pyrophosphate and purified water was inserted into a Micromeritics Saturn DigiSizer II and attached to a specimen tube (Figure 3, item 1). The laser source could be adjusted to several angles (Figure 3, items 2 and 3). The laser beam (Figure 3, item 4) hits the target and is either not affected or deflected. The scattered laser beams (Figure 3, item 5) are collected using a lens (Figure 3, item 6) and are detected by a CCD detector with high resolution (Figure 3, item 7). Due to different deflections, the CCD detector measures different intensities that are used to calculate the particle sizes and distributions of the particles. The measurements were analyzed using MINITAB and are displayed in Figure 4.
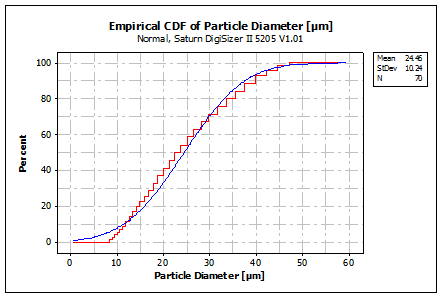
Figure 4: Empirical CDF of Ag 28 wt. % Cu
The distribution of the particle diameters was almost normal with a mean of 25 µm and a standard deviation of 10 µm. The powder supplier TLS Technik GmbH & Co Spezialpulver KG reported a specification of the particle diameters below 45 µm with a mean of 25 µm, measured with a CILAS 920 particle size analyzer (Ludwig, 2012). This result was confirmed with the measurements as shown in Figure 4.
Absorption tests were conducted for the near-infrared frequencies with wave lengths between 0.8 µm and 2.5 µm. A FT-NIR Spectrometer (Michelson Interferometer, Bruker Vector 22/N) was used. A halogen lamp (Figure 5, item 1) emitted near-infrared rays that were reflected, focused, and defocused again using an aperture (Figure 5, items 2 and 3). An additional reflector (Figure 5, item 4) modeled a parallel beam that was separated by a beam splitter (Figure 5, item 5). The reflected rays hit a fixed mirror (Figure 5, item 6), whereas the transmitted rays hit a moving mirror (Figure 5, item 7). After combination of both ray parts, the IR beam (Figure 5, item 8) showed interference due to coherent rays that were sent into an Ulbricht sphere (Figure 5, item 9) and hit the target containing the specimen (Figure 5, item 10). After several inner reflections (Figure 5, item 11), the beam hit the detector unit (Figure 5, item 12).
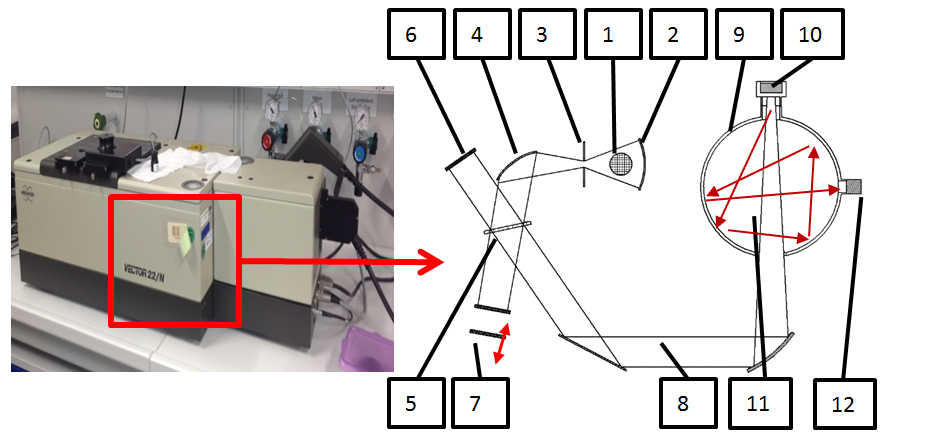
Figure 5: Absorption measurement, Ulbricht Sphere and Michelson interferometer consisting of: 1) Tungsten halogen lamp, 2) Reflector, 3) Aperture, 4) Mirror, 5) Interferometer with beam splitter and retroreflectors, 6) Fixed mirror, 7) Moving mirror, 8) IR beam, 9) Ulbricht sphere, 10) Target with sample, 11) Reflected IR beam, 12) Detector (adapted from (Bruker Analytik GmbH, 1998))
After subtracting the background scan, 64 measurements were conducted. Figure 6 displays the mean absorption rate of the tests depending on the wavelength after transformation using the Lambert-Beer-law. An absorption rate of 0.47 was achieved. The literature provided absorption rates of 0.79 for Pb, 0.77 for Ti, 0.66 for Sn, 0.64 for Fe and 0.59 for Cu, respectively (Tolochko et al., 2000). The absorption rate of Ag 28 wt. % Cu is comparably low due to the high reflectivity of the powder.
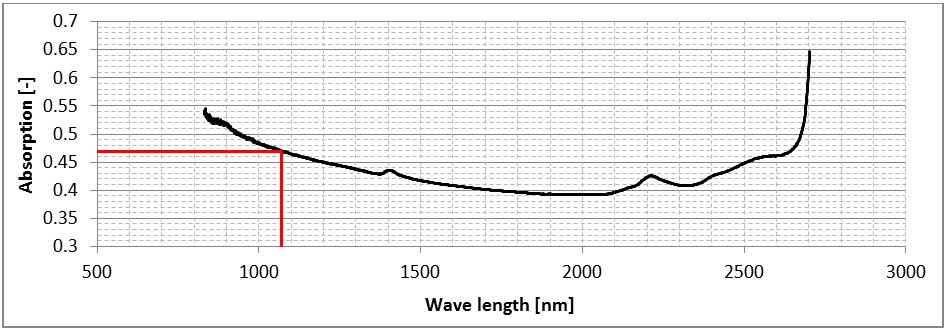
Figure 6: Absorption measurement of AgCu28, near-infrared spectrum

Figure 7: Topography (SEM, magn. 500x, first picture) and EDX-spectrum of Ag 28 wt. % Cu (second picture).
SEM and EDX analysis were conducted using a Gemini LEO 1530. The SEM proved the results of the particle diameter tests and showed that the diameters of the spheres fit to the particle distribution function. In addition, the topography of the powder is almost spherical (Figure 7, first picture). The EDX spectrum showed that the powder specimen consisted of 27.23 wt. % Cu and 72.77 wt. % Ag (Figure 7, second picture).
For the manufacturing of the specimens, a Realizer SLM 50 desktop machine was used with a maximum power output of 100 W (cw). The setup of this machine allows for variation of the spot distance and pulse time in order to increase the scan speed. The fiber laser can be focused to a spot size of approximately 15-20 µm. The wave length is 1070 nm.
The range of parameter sets was narrowed by previous screening tests and fixed to an area of interest. The geometries of the parts were hollow cubes with an edge length of 10 mm. Several cubes were assembled on a base plate (also see scheme in Figure 2). The order was randomized for all test runs. The parts were manufactured with a layer thickness of 30 µm. The scan vectors run parallel to the edge length and were positioned ten times with an offset of 30 µm to the inner sides of the cube, see Figure 8 (left).
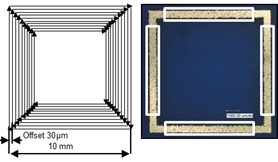
Figure 8: Scheme of scan vectors (left). Microsections and spots for porosity measurements (right)
After manufacturing and microscope imaging of the surface, microsections were made in order to assess the porosity of the parts. Four estimates were taken per sample, shown in Figure 8 (right). The parameters laser power, spot distance and pulse time were varied, whereas the scan speed and linear energy density were calculated from these parameters. The laser power is the nominal output from the fiber laser source (continuous wave). The spot distance is the distance between two different spots where the laser stops. The pulse time is the time that the laser stops at a single spot. While moving, the laser still is in cw-mode. The scan speed is the regression speed between spot distance and pulse time, considering the moving time between two spots. The linear energy density is the ratio of laser power and scan speed.
The laser power levels were adjusted between 50 W and 70 W, the spot distance between 5 µm and 15 µm, and the pulse time between 20 µs and 60 µs. The successful parameter combinations are shown in Table 1.
The number of measurements were 152, derived from 19 samples per replicate with four estimates each and two replicates. The center point was measured 48 times in total. Specimens built at parameter combination of 50 W|15 µm|20 µs failed in all tests. The linear energy density of this data point yielded 0.09 J/mm and was a factor of 9.89 lower than data point 70 W|5 µm|60 µs with the highest linear energy density of the test series.
For optimization of processes, the response surface method is known as an effective method if a response should be optimized (Montgomery, 2009).
Literature distinguishes between a first order model and second order model. A first order model only contains linear factors: y=β0+ β1 x1+ β1 x1+⋯+ βk xk+ε. Whereas a second-order model can be used to estimate response surfaces with curvature: y=β0+∑βi xi + ∑βii xi2 +∑ βij xi xj +ε (Montgomery, 2009). For the analysis of this test series, a second order model was used. The model was computed with commercial statistics software (MINITAB).
The pictures of the microsections were sorted according to increasing levels of power, increasing levels of spot distance and increasing levels of pulse time. The porosity was measured using a digital microscope (Keyence, VHX-100 with Keyence VH-Z20) and imaging processing software. Table 1 lists the parameters and mean porosity results for the specimens shown in Figure 9. Figure 9 displays one example per data point, showing microsections and the surface topography of the finished parts without grinding.
Table 1: Parameters and mean porosity for Figure 9
|
Picture |
Power [W] |
Spot dist. [µm] |
pulse time [µs] |
Scan speed [mm/s] |
Linear energy density [J/mm] |
Mean porosity [-] |
Std. dev. [-] |
|
a |
50 |
5 |
20 |
213.1 |
0.23 |
0.1115 |
0.0407 |
|
b |
50 |
5 |
60 |
78.8 |
0.63 |
0.1668 |
0.0401 |
|
c |
50 |
10 |
40 |
230.1 |
0.22 |
0.1320 |
0.0499 |
|
d |
50 |
15 |
60 |
236.4 |
0.21 |
0.1129 |
0.0489 |
|
e |
60 |
5 |
40 |
115.1 |
0.52 |
0.1124 |
0.0725 |
|
f |
60 |
10 |
20 |
401.4 |
0.15 |
0.0969 |
0.0581 |
|
g |
60 |
10 |
40 |
230.1 |
0.26 |
0.1025 |
0.0415 |
|
h |
60 |
10 |
60 |
157.6 |
0.38 |
0.0834 |
0.0316 |
|
i |
60 |
15 |
40 |
345.1 |
0.17 |
0.0608 |
0.0392 |
|
j |
70 |
5 |
20 |
213.1 |
0.33 |
0.0630 |
0.0488 |
|
k |
70 |
5 |
60 |
78.8 |
0.89 |
0.0944 |
0.0229 |
|
l |
70 |
10 |
40 |
230.1 |
0.30 |
0.1013 |
0.0398 |
|
m |
70 |
15 |
20 |
576.4 |
0.12 |
0.0429 |
0.0146 |
|
n |
70 |
15 |
60 |
236.4 |
0.30 |
0.0744 |
0.0453 |
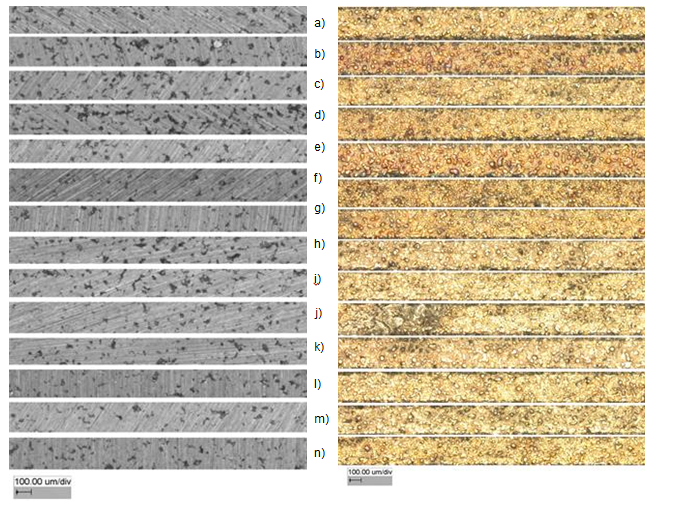
Figure 9: Microsections (left) and raw surface topography (right)
Samples a) to n) were subject to the balling phenomenon and all parts showed pores. Samples a), c) and d) all were exposed to a linear energy density between 0.21 and 0.23 J/mm. Sample b) was manufactured with a linear energy density of 0.63 J/mm and showed the highest mean porosity of the data set (16.7%). Pores with more than 30 µm diameters can be seen. The raw surface showed more annealing colors than the other surfaces. The samples e) to i) all were produced with a level of laser power of 60 W. Sample g) is the center point of the response surface data set. The mean porosity for the center point was 10.25% with a standard deviation of 4.15%. For sample e), the low spot distance and the medium pulse time yielded a scan speed of 115.1 mm/s and a linear energy density of 0.521 J/mm. The mean porosity of sample e) was 11.2%. In comparison to sample i) the linear energy density was 0.174 J/mm, but yielded a porosity of 6.1%. Samples j) to n) were manufactured with a laser power of 70 W. The mean porosity was close to or below 10%. Sample g) was manufactured with a linear energy density of 0.88 J/mm at a scan speed of 78.8 mm/s and yielded a mean porosity of 9.4%. In comparison to that, the best results were obtained for sample m) with a mean porosity of 4.3% and a standard deviation of 1.4%. Due to a scan speed of 576.4 mm/s, the linear laser energy was 0.12 J/mm.
From these results, there seemed to be a tendency of decreased porosity with increasing laser power. The analysis of the response surface showed that the tendencies are much more complex. Table 2 displays the regression coefficients, whereas Figure 10 to Figure 12 show the response surfaces and the corresponding contour plots.
Table 2: Coefficients for the Response Surface method
|
Term |
Coef |
SE Coef |
T |
P |
|
Constant |
71.9744 |
31.199 |
2.307 |
0.0230 |
|
Block |
1.5345 |
0.3339 |
4.595 |
0.0000 |
|
power |
-2.1283 |
1.0841 |
-1.963 |
0.0520 |
|
spot dist |
0.051 |
1.1272 |
0.045 |
0.9640 |
|
pulse time |
0.4382 |
0.2711 |
1.616 |
0.1080 |
|
power*power |
0.0155 |
0.0089 |
1.742 |
0.0840 |
|
spot dist*spot dist |
-0.0583 |
0.0356 |
-1.637 |
0.1040 |
|
pulse time*pulse time |
-0.0027 |
0.0022 |
-1.236 |
0.2190 |
|
power*spot dist |
0.0135 |
0.013 |
1.036 |
0.3020 |
|
power*pulse time |
-0.0021 |
0.0033 |
-0.654 |
0.5140 |
|
spot dist*pulse time |
-0.0017 |
0.0065 |
-0.262 |
0.7940 |
|
|
|
|
|
|
|
R-Sq = 35.06% R-Sq(pred) = 24.26% R-Sq(adj) = 30.45% |
||||
Besides the single factors, the quadratic terms and the first order interactions were included in the model. It was blocked on replicates.
Figure 10 displays the response surface of porosity, dependent on laser power and pulse time. The response surface shows curvature. For this data set, the minimum porosity can be expected for a laser power above 60 W at low pulse times. There is a steep ascent in porosity at high pulse times (60 µs) and low laser power (50 W).

Figure 10: Response Surface and Contour plot of porosity vs power and pulse time
Figure 11 shows the response surface of porosity depended on laser power and spot distance. The contour plot of this graph shows that, according to the model, the lowest porosity can be expected at a laser power level of 70 W and at a spot distance level of more than 12.5 µm. The highest porosity occurs nearly at the other edge of the contour plot at a laser power of 50 W and a spot distance below 10 µm.
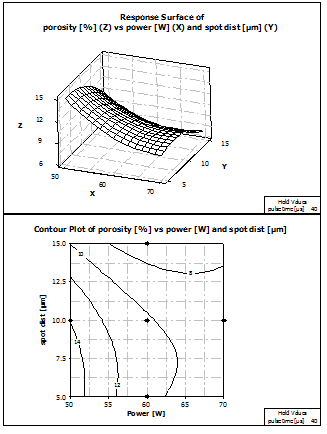
Figure 11: Response Surface and Contour plot of porosity vs power and spot distance
Figure 12 shows the response surface plot of porosity, depending on spot distance and pulse time. The surface shows a local maximum around 6 µm spot distance and 55 µs pulse time. This maximum is located in the left upper corner of the contour plot. From there, the porosities decrease in all directions of the data set. The minimum porosity can be expected at a spot distance of 15 µm and a pulse time of 20 µs.
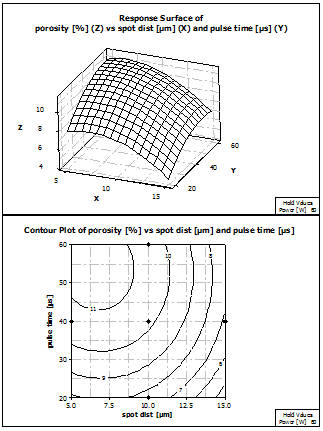
Figure 12: Response Surface and Contour plot of porosity vs spot distance and pulse time
The reason why porosity occurs is the balling phenomenon. It can be seen that an increase in power level leads to less porosity compared to a lower power level. The material has a strong tendency to ball due to its high thermal conductivity. This causes high heat gradients that support the attachment of partial melted spheres to the borders of the parts. The porosity increases as balling increases but is different for the levels of energy inputs. (Yadroitsev et al., 2010) modified the stability condition of the Plateau-Rayleigh analysis of (Chandrasekhar, 1961), stating that if the length of the meld pool exceeds the circumference of the liquid cylinder, the cylinder is separated into two segments. They used a factor of the root of 2/3 instead of one. (Li et al., 2010b) noted that a high laser power increases the temperature and hence the melt pool size. A higher temperature of the melt pool leads to a decrease in surface tension.
(Gu and Shen, 2009) noted that for low energy inputs, only the surfaces of the particles are melted whereas the cores remain solid. With increasing energy input, the necks between two liquid pools are formed so that the bonding strength between the spheres is increased. This threshold can be seen at low energy inputs for AgCu28 as well. For the lowest energy input, the bonding strength was simply not sufficient to survive the mechanical load that is applied by the wiper system of the SLM machine.
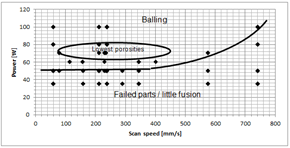
Figure 13: Process map
Process maps were published by several researchers, e. g. Childs et al. (Childs et al., 2004), Kruth et al.(Kruth et al., 2005), Khan and Dickens (Khan and Dickens, 2010) and Zhang et. al. (Zhang et al., 2012). Figure 13 shows the process map for AgCu28. Balling was detected above the minimum fusion line, indicated by failed parts. The binding energy was simply too low below that line. This threshold is approximately 50 W. The lowest porosity was detected around a laser power of 70 W. Furthermore, it can be seen that the area for the good melting region is comparably small which was also detected by Khan and Dickens for gold (Khan and Dickens, 2010). For both materials, balling is a dominating problem but might be solved with other known methods.
This work proved that Ag 28 wt. % Cu can be processed with the Selective Laser Melting process. Ag 28 wt. % Cu has both a high reflectivity and a high thermal conductivity, which makes it difficult to process. Parameter fields were analyzed by varying laser power, spot distance and pulse time with respect to linear energy density and scan speed. Best results were obtained for a laser power of 70 W with a spot distance of 15 µm and a pulse time of 20 µs. The scan speed was 576.4 mm/s and the linear energy density yielded 0.121 J/mm.
Future research should be done on limiting the variances and on expanding the parameter fields to higher power levels. Furthermore, the interaction of other parameters within the same process parameter space could be investigated, e.g. the variation of powder diameters, of preheating and scan strategies, of layer thicknesses etc. Possible applications could be solid freeform designs of switches and contacts that are printed directly on a base substrate.
BRUKER ANALYTIK GMBH 1998. Fourier-Transform-Nearinfrared-Spectrometer VECTOR 22/N user manual (German edition).
CHANDRASEKHAR, S. 1961. Hydrodynamic and hydromagnetic stability, Oxford Clarendon Press.
CHILDS, T. H. C., HAUSER, C. & BADROSSAMAY, M. 2004. Mapping and modelling single scan track formation in direct metal selective laser melting. CIRP Annals - Manufacturing Technology, 53, 191-194.
GAGANOV, A. 2010. Hochfeste und hochleitfähige Cu-Ag-Leitermaterialien PhD thesis, Technische Universität Dresden
GARTNER, J. 1970. Texturuntersuchungen bei AgCu 7,5.
GEBHARDT, A., FATERI, M., HÖTTER, J.-S., KNOTHE, M., SCHMIDT, F.-M. & RIEPER, H. 2012a. Numerical and Experimental Investigation of Selective Laser Melting of Silver. Fraunhofer Direct Digital Manufacturing Conference (DDMC) 2012. Berlin.
GEBHARDT, A., HÖTTER, J.-S., FATERI, M., KNOTHE, M., SCHMIDT, F.-M. & RIEPER, H. 2012b. Prozessoptimierung des SLM-Prozesses mit hoch-reflektiven und thermisch sehr gut leitenden Materialien durch systematische Parameterfindung und begleitende Simulationen. Rapid Tech 2012. Erfurt.
GIBSON, I., ROSEN, D. W. & STUCKER, B. 2010. Powder Bed Fusion Process. In: GIBSON, I., ROSEN, D. W. & STUCKER, B. (eds.) Additive manufacturing technologies rapid prototyping to direct digital manufacturing. New York, NY: Springer.
GU, D. & SHEN, Y. 2009. Balling phenomena in direct laser sintering of stainless steel powder: Metallurgical mechanisms and control methods. Materials and Design, 30, 2903-2910.
HAMMOND, C. R. 2003. Melting, Boiling, and Critical Temperatures of the Elements. In: LIDE, D. R. (ed.) CRC Handbook of Chemistry and Physics. Boca Raton, Florida: Chemical Rubber Publishing Company.
HANSEN, M. 1958. Constitution of Binary Alloys, New York, McGraw-Hill Book Company Inc.
KATTNER, U. 2003. Ag-Cu System [Online]. Metallurgy Division of the Materials Science and Engineering Laboratory (MSEL) at the National Institute of Standards and Technology (NIST). Available: http://matdl.org/repository/eserv/matdl:539/web_agcu-w.jpg [Accessed 12-21 2011].
KHAN, M. & DICKENS, P. 2010. Selective Laser Melting (SLM) of pure gold. Gold Bulletin, 43, 114-121.
KRUTH, J. P., FROYEN, L., VAN VAERENBERGH, J., MERCELIS, P., ROMBOUTS, M. & LAUWERS, B. Selective laser melting of iron-based powder. 14th International Symposium on Electromachining (ISEM XIV), 30 March-1 April 2004, 2004 Switzerland. Elsevier, 616-22.
KRUTH, J. P., MERCELIS, P., VAN VAERENBERGH, J., FROYEN, L. & ROMBOUTS, M. 2005. Binding mechanisms in selective laser sintering and selective laser melting. Rapid Prototyping Journal, 11, 26-36.
LI, R., SHI, Y., LIU, J., XIE, Z. & WANG, Z. 2010a. Selective laser melting W-10 wt.% Cu composite powders. International Journal of Advanced Manufacturing Technology, 48, 597-605.
LI, R., SHI, Y., WANG, Z., WANG, L., LIU, J. & JIANG, W. 2010b. Densification behavior of gas and water atomized 316L stainless steel powder during selective laser melting. Applied Surface Science, 256, 4350-4356.
LUDWIG, P. 2012. RE: CILAS 920 Measurement Report provided by TLS Technik GmbH & Co Spezialpulver KG, Bitterfeld, Germany.
MEINERS, W. 1999. Direktes selektives Laser-Sintern einkomponentiger metallischer Werkstoffe, Aachen.
MICROMERITICS INSTRUMENT CORPORATION. 2013. Light Scattering Analysis Technique Micromeritics [Online]. Available: http://www.micromeritics.com/product-showcase/Saturn-DigiSizer-II/Light-Scattering-Analysis-Technique.aspx [Accessed 26-05 2013].
MONTGOMERY, D. C. 2009. Response Surface Methodology. In: MONTGOMERY, D. C. (ed.) Design and Analysis of Experiments. 7. ed., internat. student version ed. Hoboken, NJ: Wiley.
MUMTAZ, K. A., ERASENTHIRAN, P. & HOPKINSON, N. 2008. High density selective laser melting of Waspaloy. Journal of Materials Processing Technology, 195, 77-87.
OVER, C. 2003. Generative Fertigung von Bauteilen aus Werkzeugstahl X38CrMoV5-1 und Titan TiAl6V4 mit "Selective Laser Melting", Aachen, Shaker.
RIEPER, H. 2013. Systematic Parameter Analysis for Selective Laser Melting (SLM) of Silver-Based Materials. University of Louisville.
TLS TECHNIK GMBH & CO. SPEZIALPULVER KG 2012. Crucible Free Melting. information provided by Norbert Ludwig, TLS
TOLOCHKO, N., MOZZHAROV, S., LAOUI, T. & FROYEN, L. 2003. Selective laser sintering of single- and two-component metal powders. Rapid Prototyping Journal, 9, 68-78.
TOLOCHKO, N. K., LAOUI, T., KHLOPKOV, Y. V., MOZZHAROV, S. E., TITOV, V. I. & IGNATIEV, M. B. 2000. Absorptance of powder materials suitable for laser sintering. Rapid Prototyping Journal, 6, 155-160.
TOLOSA, I., GARCIANDIA, F., ZUBIRI, F., ZAPIRAIN, F. & ESNAOLA, A. 2010. Study of mechanical properties of AISI 316 stainless steel processed by "selective laser melting", following different manufacturing strategies. International Journal of Advanced Manufacturing Technology, 51, 639-647.
VINARICKY, E. 2009. Datenbuch der elektrischen Kontakte : Kontaktwerkstoffe, Halbzeuge (Engl. translation: "Data book of electrical contacts: contact materials, pre-products"). In: VINARICKY, E. (ed.) 3rd ed. Mühlacker: Stieglitz Verlag.
YADROITSEV, I., GUSAROV, A., YADROITSAVA, I. & SMUROV, I. 2010. Single track formation in selective laser melting of metal powders. Journal of Materials Processing Technology, 210, 1624-1631.
ZHANG, B., LIAO, H. & CODDET, C. 2012. Effects of processing parameters on properties of selective laser melting Mg-9%Al powder mixture. Materials and Design, 34, 753-758.
ZHAO, X. K., TANG, J. W., LAN, L., HAUNG, J. H., ZHANG, H. & WANG, Y. 2009. Vacuum brazing of NiTi alloy by AgCu eutectic filler. Materials Science and Technology, 25, 1495-1497.
Dr. Harald Rieper
University of Louisville, Department of Industrial Engineering
Louisville, KY 40292
USA
Tel.: +49 2451 911 511 40
Fax: +49 2451 911 511 41
E-mail:
harald.rieper@louisville.edu
Prof. Dr.-Ing. Andreas Gebhardt
Aachen University of applied Sciences
Goethestraße 1
52064 Aachen
Germany
Email:
gebhardt@fh-aachen.de
WEB:
www.fh-aachen.de
Dr. Brent Stucker
University of Louisville, Department of Industrial Engineering
Louisville, KY 40292
USA