Untitled Document
© 2014 Enno Ebel; Lizenznehmer RTejournal, weitere Informationen sind zu finden unter: http://www.dipp.nrw.de/service/dppl/
urn:nbn:de:0009-2-38722
Fused Deposition Modeling (FDM) is a production method within the field of 3D printing [1] that produces parts layer by layer (see figure 1). In the last years several new printer models entered the market, especially in the low-cost sector [2, 3, 4], using not only ABS, but also PLA thermoplastics.
Our aim was to compare some of the properties of FDM printed parts produced under varying conditions:
• The material used (ABS or PLA)
• The filling method of the parts (completely filled with line pattern or partially filled with honeycomb pattern)
• The 3D-FDM-printer used (Felix 1.0e, CB-printer or uPrint Plus)
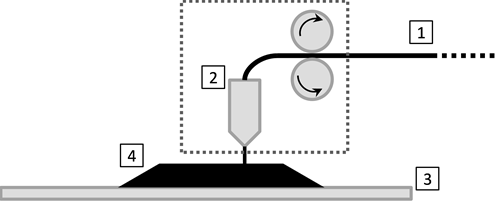
Figure 1: Material (1) is forwarded into the heated extruder (2). The plastic melts and is extruded onto the printer bed (3), where it cools down. Due to the relative motion of the extruder and the printer bed to one another, the printed part (4) is formed.
The tensile test was used for the determination of mechanical material properties. For this purpose a test sample is being clamped in a universal testing machine. The sample is then being stretched until breaking. The force used to stretch the sample and the length variation of the sample are recorded and transferred into a stress strain diagram.
Since there is no standard for the testing of FDM parts, our method follows the DIN EN ISO 527. This standard is appropriate for the tensile test of plastic samples in general [5]. We used the sample 1A as described in DIN EN ISO 527-1. The geometry is shown in figure 2.
To evaluate the influential factors, the following batches, each with at least five samples, were printed:
Felix 1.0e and CB-printer:
• ABS, completely filled (line pattern)
• ABS, partially filled (honeycomb pattern)
• PLA, completely filled (line pattern)
• PLA, partially filled (honeycomb pattern)
uPrint Plus:
• ABSplus, completely filled (line pattern)
Measurements were performed with a Zwick 1446 tensile testing machine. For the determination of the Young’s modulus an initial speed of 1 mm/min was chosen. After 0.25 % elongation the speed was increased to 5 mm/min. The resulting stress-strain curves show values such as the Young's modulus, the yield strength, the breaking strength, as well as the elongation at yield and at break. The ambient air temperature during the tensile test was 23°C.

Figure 2: Test sample 1A according to DIN EN ISO 527-1, all values in mm [6]

Figure 3: Filling method, left: Line pattern (lines turned by ± 45° around the horizontal axis), right: Honeycomb pattern
In the following paragraphs, a three letter code will be used to identify the batches:
1. Printer Type 2. Material 3. Pattern.
Accordingly, the abbreviation FAH stands for "Felix printer, ABS, Line pattern", whereas CPH means "CB printer, PLA, Honeycomb pattern".
The stress strain diagrams of typical samples are shown in figure 4. The x-axis shows the strain in percent, on the y-axis the stress σ is shown in megapascal.
On the basis of the diagram it can be seen that the curve shapes of the batches FAH, CAH, FPH and CPH are nearly similar. They are showing approximately the same elongation at yield εy of around 2 %. The belonging yield strength is between 14 and 21 MPa. The batches FAH, FPH and CPH display a low elongation at break εb of about 2.2 to 2.5 %. The break takes place before reaching the yield strength. The elongation at break of the batch CAH is minimally larger with a value of 2.8 %. This shows that all mentioned batches are relatively brittle. Only the batch UAL has a larger ductility. The elongation at break is about 6 %.
The yield strength of the batch CAL has a value of 23 MPa. The corresponding elongation at break is about 4 %.
The batch FAL shows a clearly larger Young’s modulus than the batches mentioned before. Together with an elongation at break of 2 %, this leads to a relatively high yield strength of 33 MPa.
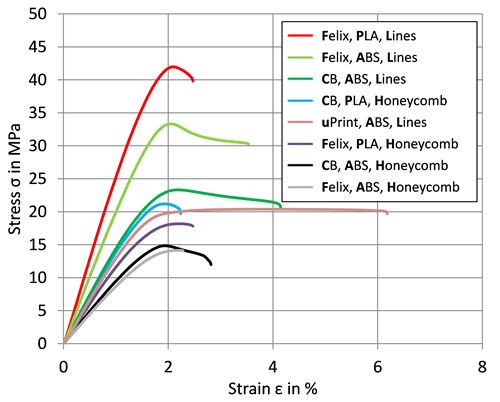
Figure 4: Characteristic stress strain curves of FDM samples.
The analysis of the curve shapes shows some interesting details.
On one hand the combinations with honeycomb pattern have relatively low yield strengths; on the other hand they are brittle. The elongation at yield is nearly identical; however the yield strength of the PLA samples is larger than of the ABS samples.
Furthermore the yield strength of the samples with line pattern can be compared to the yield strength of the samples with honeycomb pattern. If the UAL batch is left out, we notice that the line pattern as expected leads to higher yield strength. Within the batches with line pattern we find that PLA has better strength properties than ABS.
Furthermore it can be seen that the combination of ABS and line pattern leads to relatively ductile samples. In particular the batch UAL displays a high elongation at break in this context.
The stress strain diagrams of the samples CPL2 and CPL4 showed a drop in the range of the Young’s modulus. For the determination of the Young’s modulus, a linear curve shape is necessary. Therefore the samples CPL2 and CPL4 were excluded completely from the analysis.
Within this section the Young’s moduli of all batches are analyzed with the use of a bar chart.
It should be noted that all samples of a batch were used, with the exception of samples CPL2 and CPL4 where the Young’s modulus could not be determined. The Young’s modulus in megapascal and the arithmetic mean of the batches are shown in figure 5. This figure displays that the batches FAH and CAH have the lowest Young’s modulus of about 900 MPa, followed by the batches FPH and UAL with a Young’s modulus between 1200 and 1300 MPa. They are followed by the batches CPH and CAL with a value between 1400 and 1500 MPa, and the batches FAL and CPL with 1900 MPa. The batch FPL has the highest Young’s modulus of about 2600 MPa.
The distribution of the arithmetical means is very low (between ± 10 and ± 50 MPa).
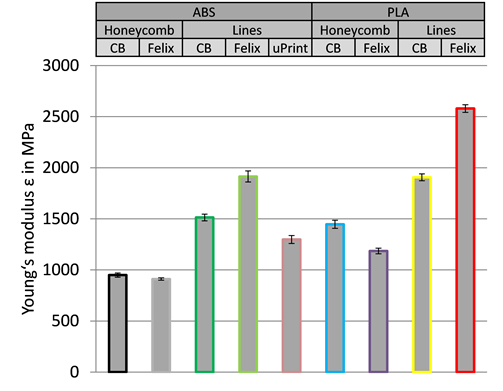
Figure 5: Averaged Young’s modulus with belonging standard deviations of all batches.
The Young’s moduli show, that the combination of ABS and honeycomb pattern leads to test samples that have a low resistance against deforming. A difference between the printers Felix 1.0e and CB-printer cannot be shown. Noticeable is that there are four samples with honeycomb pattern under the five lowest Young’s moduli values. But in contrast to the honeycomb pattern, the batch UAL features a very high ductility.
A direct comparison between two samples from the same printer show a noticeable difference: Test samples with line pattern display – apart from the batch UAL – a higher resistance against deforming than those with honeycomb pattern. A sample of the CB-printer with line pattern has a 1.3 to 1.6 times higher resistance against deforming. The Felix 1.0e has a corresponding value of about 2.1.
The comparison between the samples made out of PLA and ABS with the same pattern and the same printer shows that PLA has an about 1.25 to 1.5 times higher resistance against deforming than ABS.
The low standard deviation for all batches demonstrates a stable manufacturing process, leading to reproducible results.
This chapter deals with the yield strength of all batches. These values are again shown in a bar chart in figure 6. The diagram shows the mean values of all batches except CPL.
It can be seen that the batches FAH and CAH have the lowest yield strength of about 14 MPa. They are followed by FPH with about 18 MPa, UAL with 20 MPa, CPH with 22 MPa and CAL with 23 MPa. The highest yield strengths belong to FAL with 32 MPa FPL with 42 MPa. The standard deviation of all batches lies between ± 0.2 MPa and ± 1 MPa.
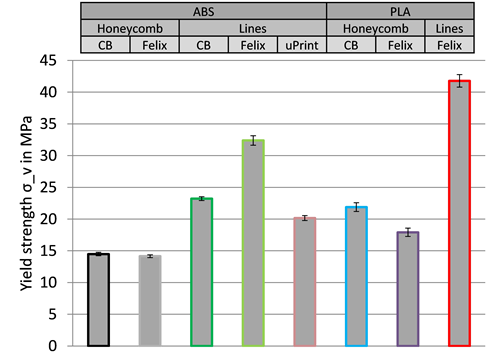
Figure 6: Averaged yield strength with belonging standard deviations of all batches (except CPL).
On the basis of this data it can be displayed that a honeycomb pattern leads to low yield strength. A comparison between line and honeycomb pattern shows that a line pattern leads to a 1.6 to 2.3 times higher yield strength.
A comparison of ABS and PLA shows that a PLA sample has a 1.2 to 1.5 times higher yield strength.
The specific strength is a value relevant for lightweight construction. Here not only the strength of a material is taken into account, but also the density. A high value of the specific strength characterizes a material suitable for lightweight construction.
The specific strength is shown in a bar chart in figure 7. The batch CAH has a specific strength of 21.7 Nm/g followed by UAL with 23.1 Nm/g , CAL with 23.8 Nm/g , FAH with 25.8 Nm/g , CPH with 27.1 Nm/g and FPH with 31.2 Nm/g . The highest values have the batches FAL with 36.6 Nm/g and FPL with 39.1 Nm/g.
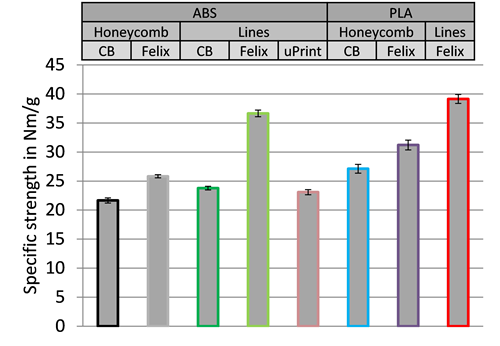
Figure 7: Averaged specific strength and standard deviations.
As expected, the deviations between the batches are lower than in the yield strength diagram.
A direct comparison between samples with line and honeycomb pattern shows that the line pattern has a 1.1 to 1.4 times higher specific strength.
Comparison between PLA and ABS displays a 1.1 to 1.3 times better value for PLA.
So if a high specific strength is needed, a combination of PLA and line pattern would be appropriate.
The batch UAL shows a relatively low specific strength, however the material is ductile, suited for a different field of application.
The low standard deviation within the batches for all measured values clearly shows that the process of FDM manufacturing is stable and provides reproducible results.
The elongation at yield of all samples of Felix 1.0e and CB-printer have a value of about 2 %. This allows a good comparability of the other parameters relevant for dimensioning. The uPrint Plus batches show a very high elongation at yield (4 %) and at break. In comparison with the other, more brittle batches, these are very ductile.
The evaluation of the Young’s moduli shows that the resistance against deforming varies strongly depending on the chosen combination. For the combination of ABS and honeycomb pattern, the Young’s modulus is very low. A direct comparison between two batches that only differ in the chosen material shows that PLA provides a 1.25 to 1.5 times better resistance against deforming than ABS. A line pattern provides a 1.3 to 2.1 times higher Young’s modulus than a honeycomb pattern. If a high resistance against deforming is needed, a combination of line pattern and PLA should be chosen.
Samples with line pattern, in combination with PLA if possible, show high yield strength. Samples with line pattern have a 1.1 to 1.4 times higher specific strength than samples with honeycomb pattern. This means that the benefit of a more lightweight construction using the honeycomb fill pattern is more than compensated by the loss in yield strength.
Comparing the materials, PLA shows a 1.1 to 1.3 times higher specific strength than ABS. The highest specific strength values are reached by a PLA line pattern batch that has been manufactured with the Felix 1.0e.
As mentioned above, samples printed with a Felix 1.0e or a CB-printer are relatively brittle compared to samples printed with a uPrint Plus. If an elastic object with high ductility is needed for construction, the uPrint Plus should be chosen for manufacturing. This printer provides samples with an elongation at yield of about 4 % and an elongation at break of more than 6 %.
The process of FDM manufacturing can provide good and reproducible results regarding the mechanical strength of the printed parts. This applies both to the inexpensive printers Felix 1.0e and CB-printer as well as to the higher-priced uPrint Plus. From the point of view of materials, PLA may play a more prominent role in the future.
The authors would like to thank Prof. Dr.-Ing. Wilfried Fischer, Dipl.-Ing. Walter Fürsich, Thomas Heiduck and Gerhard Borowski (Fachhochschule Dortmund) for their valuable support.
Special thanks go to Dipl.-Ing. Jörg Fisseler and Prof. Dr.-Ing. Hans-Peter Heim (Universität Kassel), who enabled us to perform the tensile test at the local institute for materials engineering.
We would also like to thank Piotr Krygowski (CB-printer.com) for printing multiple samples with the CB-printer, and Guillaume Feliksdal (FelixRobotics) for the good cooperation.
[1] A. Gebhardt: Generative Fertigungsverfahren: Rapid Prototyping - Rapid Tooling - Rapid Manufacturing, 3. Auflage, Hanser Fachbuchverlag, München, 2007.
[2] F. Horsch: 3D Druck für alle, Hanser Fachbuchverlag, 2013
[3] P. Fastermann: 3D-Druck/Rapid Prototyping, Springer, Berlin, 2012
[4] E. Gradl, F. Horsch, M. Kraus, M. Mahler: Open Source Rapid Prototyping – Präzisionsmessungen anhand des Ultimakers, Universität Bayreuth, 2011
[5] DIN Deutsches Institut für Normung e.V.: DIN EN ISO 527-1, Beuth, Berlin, 2012
[6] DIN Deutsches Institut für Normung e.V.: DIN EN ISO 527-2, Beuth, Berlin, 2012
Enno Ebel, B. Eng.
Fachhochschule Dortmund
Fachbereich Maschinenbau
Sonnenstraße 96
44139 Dortmund
E-Mail:
enno.ebel@web.de
Web:
http://www.fh-dortmund.de/
Prof. Dr. rer. nat. Thorsten Sinnemann
Fachhochschule Dortmund
Fachbereich Maschinenbau
Sonnenstraße 96
44139 Dortmund
E-Mail:
thorsten.sinnemann@fh-dortmund.de
Web:
http://www.fh-dortmund.de/