Untitled Document
© 2013 Jan-Steffen Hötter; Lizenznehmer RTejournal, weitere Informationen sind zu finden unter: http://www.dipp.nrw.de/service/dppl/
urn:nbn:de:0009-2-38528
Surface quality of AM processes and especially of metal sintering (SLM) is still an issue. While there are many post processing approaches for macro-scale parts, meso-scale parts can hardly be post-processed. Consequently the desired geometric precision must be made in-process which, as a precondition, requires a smooth surface quality.
The paper deals with how the build parameters can be influenced in order to guarantee a part precision that meets the theoretical accuracy of the machine. In detail different construction angles and exposure strategies are built and investigated. As a result, recommendations regarding the desired part properties of filigree parts are made.
The component’s surface quality highly depends on machinespecific parameters. For this reason, research is focused on the layer thickness and machinespecific hardware to avoid the negative effects of the stair stepping effects. [GEB-07] Besides that and to avoid designing a new machine with high investment costs, the first step is the optimization of the process parameters with current machines, which is in the focus of this paper. E. Yasa et al. [YAS-12] investigated a so-called “two-zone-technique” that includes a laser surface remelting of the boundary area and the upper surface and ends in a better surface quality and a higher density. E. Yasa et al. [YAS-09] investigated the influence of several hatch-strategies on the roughness of the topsurface. The influence of build direction on mechanical properties wich has a significant influence on the bending strenght and elongation was analyzed by J.Delgardo et al. [DEL-11]. H. Krauss [KRA-13] investigated the manufacturability by characterizing single melt tracks and thin wall structures. I. Smurov et al. [SMU-07] examined the impact of the builded part mass and the thermal conductivity of the used material wich increases layerwise. The relation between the exposure strategy and the heat distribution in the molten layer using Silver powder was analyzed by Fateri et al. The conclusion was an exposure strategy that avoids negative effects like buckling effect. [FAT-12] The impact of alloying elements to reduce the bulling-effect was tested by Kruth et al [KRU-03]. With the addition of phosphor in the powder, the surface tension was set down and the bulling-effect was eliminated. G. Strano et al. [STR-12] investigated the impact of the stair-stepping effect and adhesions in relation to the construction angle concluded in the surface roughness. The investigation of a recommendation of suitable hatch strategies depending on desired part properties including metered values and taking into account process stability and reproducibility cannot be found in literature yet.
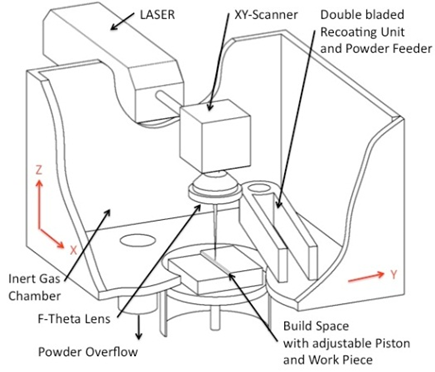
Fig. 1: SLM Process, scheme
For the study a SLM-50 Desktop machine by Realizer was used. No hardware changes were made. A scheme of the machine is displayed in Figure 1.
The heart of the SLM machine is the build space that contains the powder bed on top of which the actual layer of the part is processed. This is done by a laser beam that locally melts the powder according to the contour obtained from the part’s CAD data, leaving a solid track after re-solidification.
To process a subsequent layer, a piston, that defines the bottom of the powder bed and the lower edge of the part respectively, is lowered by the amount of one layer thickness. New powder is applied by means of the double bladed recoating unit and the geometry of the next layer is submitted to the scanner and processed according to the preceding one. So the part is made successively layer by layer from the bottom to the top. To prevent oxidation of the powder, the process takes place under shielding gas. Typically Argon or Nitrogen is used.
The machine is equipped with a Yb:YAG fiber laser that delivers a 100W laserbeam at a wavelength of 1070 nm. The laser spot size is ≈15 µm. The recoating system delivers a layer thickness of 25 µm.
The analyzed material is a tool steel (1.2344) that is typically used for tooling applications, e.g. stamp, die cast and injection mould tools, because of its high hardness (about 50 HRC). The powder size distributes in a range of 20 to 65 µm. In table 1, the composition is shown.
|
Element |
[%] |
|
Fe |
rest |
|
Cr |
4,75 - 5,5 |
|
Mo |
1,1 - 1,75 |
|
Si |
0,8 - 1,2 |
|
V |
0,8 - 1,2 |
|
C |
0,32 - 0,45 |
|
Mn |
0,2 - 0,5 |
Table 1: Composition of the applied tool-steel [REAc-12]
To investigate the impact of different construction angles on the surface quality of the produced part, simple cuboids with different angles were analyzed.
This geometry allows to examine different effects such as deformation and accuracy, but also metered values for the surface quality, in this case the mean roughness index. The metered value is a combination of the stair step-effect which is shown in Figure 2 and adhesions. The adhesions are caused by the significant difference in thermal conductivity between solid material and powder in the semi-melted phase.
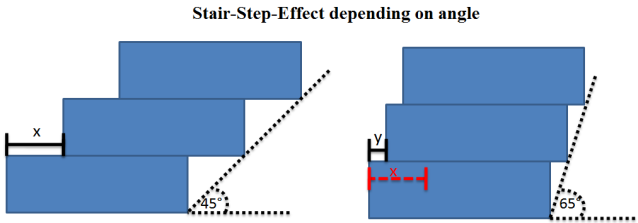
Fig. 2: Stair-Step-Effect depending on angle
To analyze a wide range of different angles related to the building direction (typically z-axle), a range between 45 and 90 degrees is chosen. Due to thermal stress, which causes deformation, angles smaller than 45° are not analyzed because the surface that is investigated has to be supported. Additionally to the construction angle, the volume of the part is another aspect that has to be studied. For that reason, two different sizes of cuboids with dimensions of 5x5x10 mm and 10x10x20 mm in x-, y- and z-direction are produced. In Table 2, a group of five parts is defined as standard. The cuboid block 90°/85° is build using two different angles to increase the angle range and to investigate the impact of small angle changes on the surface quality.
|
Size Device |
10x10x20 |
5x5x20 |
|
Block 45° |
X |
X |
|
Block 65° |
X |
X |
|
Block 90°/85° |
X |
Table 2: Standardgroup per Experiment
The mean surface roughness index is measured with a stylus instrument Perthometer M2 of Mahr GmbH.
The four surfaces of the produced parts are named as followed: Inner surface, outer surface, right and left. To avoid measuring inaccuracy, each surface is measured at three different positions with a measurement distance of 5,6 mm.
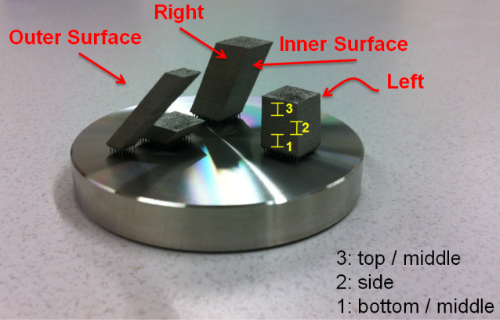
Fig. 3: Description of different surfaces and measure range
In Figure 3, the divided surfaces are visualized and a typical test building platform is shown. Each surface has three different measurement areas (yellow labeled) to avoid adulteration of the metered values.
Table 3 shows important initial process parameters. These parameters are based on prior studies and own findings.
|
Start parameters |
|
|
Powdersize: |
max. 63 µm |
|
Laserpower [W] |
48 |
|
Scanspeed [mm/s] |
250 |
|
Layer Thickness [µm] |
25 |
|
Hatchdistance [µm] |
110 |
|
Laserspot [µm] |
10 - 20 |
|
Preheating [°C] |
150 |
Table 3: Start parameters/Initial settings
In the following sections, different build parameters and their impact on the surface quality of the produced parts are explained.
Exposure order
The exposured layers are divided into two exposure groups: the outer solid area, which is the boundary of the part and the hatch area, which describes the solid part of each layer.
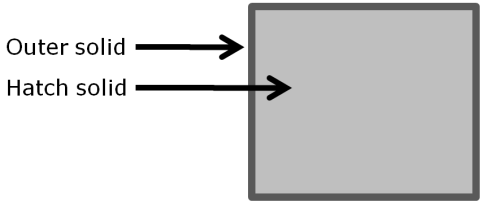
Fig. 4: Relevant exposure groups
The exposure order is changed in two ways:
Outer solid -> hatch solid
Hatch solid -> outer solid
The first test with an initial exposure of the outer line shows the best results comparing the different exposure orders (Fig. 5).
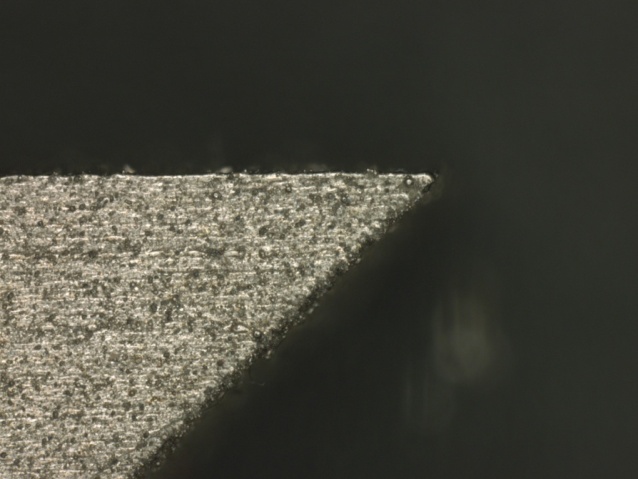
Fig. 5: Surface with high density
Using the optimized parameters for a single track, the outer solid line has a high density and the best measured surface quality. The hatch area is able to transfer the heat into the already solidified line without increasing the surface quality and creating more adhesions.
The second test which includes the change of the order of the exposure of the solid and hatch area, shows pores and holes on the surface (Fig. 6).
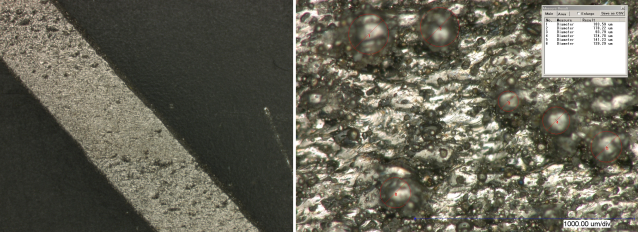
Fig. 6: left: surface with low density; right: 200-times magnified
Conspicuously, the highest amounts of adhesions are found right on top of the pores. The reason for that can be found in a bad connection between the hatched area and the outer solid area shown in Fig. 7. Due to the alternating hatch vector generation, holes created in the layer below are recoated with powder and remelted with the normal parameter set. Because of the lower thermal conductivity of the powder compared to the solid material, the powder inside the hole in the layer below is remelted but not with full depth penetration. The surface tension of the melt pool causes the powder inside the hole to solidify as a ball, which is attached at the outer solid line. This results in a rough surface.
A higher laser power in combination with a faster scan speed resulting in a remelting of the hatch area and a change of the distance between hatch and solid area can avoid this effect, but is not part of this paper.
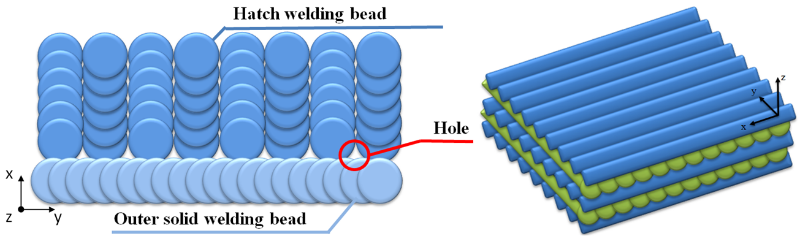
Fig. 7: (1) Top view of current layer; (2) alternating building
Measuring the surface quality with the experimental set-up explained above, two characteristics can be observed.
The first characteristic is the dependence between the adhesions and the stair-stepping-effect. Because of the layer wise manufacturing and the powder based process, parts designed with a small angle related to the building direction (see Fig. 2) have layers that are partly created on solid material and partly on loose powder.
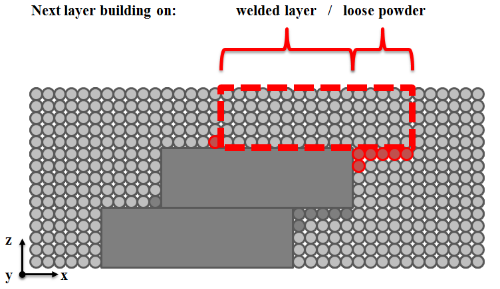
Fig. 8: Layer melted on different foundation material
Due to the difference in thermal conductivity of loose powder and solid material and using the same parameter set for these areas, areas with an overlap to loose powder have more adhesions than areas built on solid material (Fig. 8).
The second characteristic is the dependence between the surface roughness and the starting point of the laser. Reasons again can be found in the different heat conductivities of loose powder and solid material.
At the beginning of the exposure of the layer, the heat needed for melting the powder can only dissipate to the layer below. Because of the bad heat conductivity in the layer and the powder size distribution, smaller particles around the melted line are semi-melted and attached at the surface of the melted line.
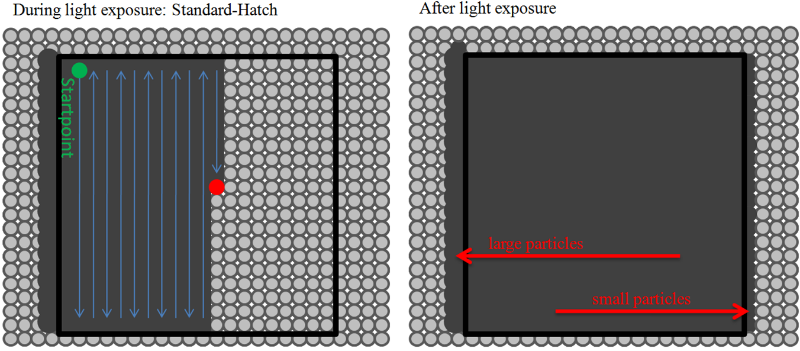
Fig. 9: left: during exposure; right: after exposure with more adhesions on the startside
After the solidification of the first line, the next melted line dissipates the applied energy in the solid first line and a better melt pool can be monitored (Fig. 9).
Different mean roughness indexes are measured because of the dynamic change of the heat conductivity of the manufactured layers.
|
Device Surface |
B 45 5x5x20 |
B 65 10x10x20 |
B 90/85 10x10x20 |
|
Outer Surf./90 ° |
8,009 |
6,381 |
5,375 |
|
Right |
6,794 |
7,23 |
6,975 |
|
Left |
5,872 |
5,45 |
5,523 |
|
Inner Surface |
10,54 |
6,176 |
6,017 |
Table 4: Metered surface roughness Ra in µm in relation to different surfaces
To avoid the effect of different surface roughnesses of the produced part, the hatch strategy has to be optimized.
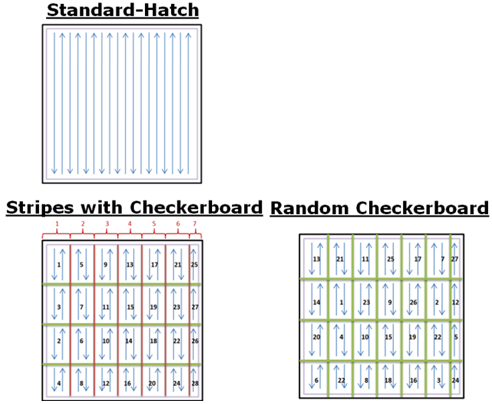
Fig. 10: Different hatch strategies
The hatch strategy influences the surface quality of the produced part in a strong way. To understand the relation between hatch strategy and surface quality, different hatch strategies are tested. In Fig. 10, the investigated hatch strategies are shown.
The standard hatch strategy is used to test the exposure order and contains different surface roughnesses in relation to the starting point of the laser.
To avoid this effect, the so-called “stripes with checkerboard” strategy is used. Regarding this exposure strategy, the layer is divided into defined stripes (size is changeable, in this study it is fixed to 2 mm). This stripes are again divided into small fields (again: size is changeable, fixed here to 2 mm), so the surface of the layer is divided like a checkerboard pattern.
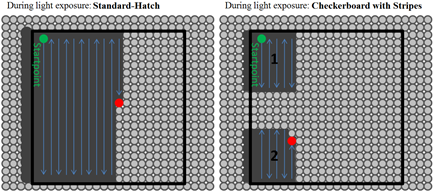
Fig. 11: left: Standard-hatch; right: checkerboard with stripes strategy
This checkerboard pattern is exposed field by field, but always with one free field between the exposed fields to reduce a heating-up of the whole part because this would result in a worse surface quality. In Fig. 11, the standard hatch and the checkerboard with stripes strategies are compared.
The surface quality increases because the heat distribution in the melted layer is improved and each checkerboard field has the possibility to cool down. Another effect of this strategy is that the surface roughness is independent of the starting point of the laser due to the better heat distribution in the layer compared to standard hatch, which includes a high heating-up of the whole part.
|
Device Surface |
Standard- Hatch in µm |
Checker-board in µm |
Percentaged deviation in % |
|
Outer Surf./90 ° |
5,375 |
4,867 |
9,45 |
|
Right |
6,975 |
4,3 |
38,35 |
|
Left |
5,523 |
4,389 |
20,53 |
|
Inner Surface |
6,017 |
4,294 |
28,64 |
Table 5: Metered surface roughness Ra: comparison of standard-hatch and checkerboard-strategy
Another hatch strategy is the so-called “random checkerboard” exposure order. In contrary to the checkerboard strategy, the checkerboard fields are not exposed stripe per stripe, but randomly all over the layer. By using this exposure order, the heat distribution in the layer can be optimized. Unfortunately, this strategy produces worse surfaces qualities than the checkerboard with stripes method. The reason can be found in random non-overlap of the different checkerboard fields. The exposed field can cool down but has no connection to the outer solid boundary or other already solidified fields. So, the shrinkage and the heat distribution in the field are non-linear and cause a bad surface quality. The checkerboard with stripes strategy combines a preferable heat distribution and a controllable shrinkage due to the connection between the fields in the generated stripes.
This shrinkage phenomenon can also be seen in Table 6. The dimensions are metered with a caliper. The values are the differences of a target-performance comparison. R-L is the dimension between right and left surface, I-O is the dimension between inner and outer surface (see also Fig. 3).
The metered values marked with green, show the best results. Parts produced using the stripes with checkerboard strategy have the highest accuracy. The reason for that can be found in the stripe per stripe exposure strategy that, on the one hand, reduces adhesions and, on the other hand, reduces thermal stress.
|
Size difference in mm per hatch strategy |
|||
|
Experiment Block with math. size |
Standard-Hatch |
Stripes with Checkerboard |
Random Checkerboard |
|
B45 10x10x20 |
|||
|
R-L = 10 |
- |
0,08 |
0,11 |
|
I-O = 7,071 |
- |
0,279 |
0,449 |
|
B45 5x5x20 |
|||
|
R-L = 5 |
0,07 |
0,13 |
0,15 |
|
I-O = 3,536 |
0,18 |
0,174 |
0,294 |
|
B65 10x10x20 |
|||
|
R-L = 10 |
0,05 |
0,01 |
0,12 |
|
I-O = 9,063 |
0,23 |
0,137 |
0,187 |
|
B65 5x5x20 |
|||
|
R-L = 5 |
- |
0,04 |
0,11 |
|
I-O = 4,532 |
- |
0,108 |
0,198 |
|
B90/85 10x10x20 |
|||
|
R-L = 10 |
0,0 |
0,04 |
0,05 |
Table 6: Measured difference at different parts with different hatch strategies
The random checkerboard strategy evokes stress in the solidified areas, caused by the random light exposure. This leads to uneven deformations.
In order to take into account the economic aspects, the required construction times, respectively for the exposure- and hatch-strategy, are being compared. It shows that less roughness and process safety are in conflict with economic viability. Depending on exposure- and hatch strategy the respective exposurelengths per blocksize are measured. The results are shown in table 7.
|
Exposurelength per Blocksize and Experiment [s] |
||
|
Size Experiment |
10x10x20 |
5x5x20 |
|
Exp.1: Standard-Hatch |
3,6 |
0,98 |
|
Exp. 4: Stripes with Checkerboard |
4 |
1 |
|
Exp. 5: Random Checkerboard |
4,4 |
1,1 |
Table 7: Exposurelength per Experiment and Blocksize
Depending on the multiple exposures or hatch strategies, different exposurelengths can appear on the respective layer.
After taking all the experiments, which have been classified by construction angle, into account, the results show that an angle between 45° to 65° increases the roughness drastically. The high roughness of cuboidal blocks with a construction angle of 90° is due to the amount and size of the adherent particles. Cuboidal blocks with a construction angle of 45°are strongly influenced by the stair-stepping-effect. Table 8 shows cuboidal blocks from three different experiments.
|
Averaged Ra [µm] depending on angle |
||
|
Device |
Outer Surface |
Inner Surface |
|
B45 10x10x20 |
7,473 |
9,813 |
|
B65 10x10x20 |
5,462 |
7,436 |
|
B90/85 10x10x20 |
5,352 |
5,673 |
|
|
|
|
|
B45 5x5x20 |
6,922 |
7,869 |
|
B65 5x5x20 |
5,833 |
6,796 |
Table 8: Averaged Ra depending on angle
The influence of the construction volume on the roughness has been analyzed with two different cuboidal block sizes. The respective construction angles were 45° and 65°. According to table 9, in the five experiments in which a cuboidal block of 10x10x20 is used, the results show that the averaged roughness was 6% higher.
|
Volume effect on averaged Ra [µm] |
|
|
Blocks with 10x10x20 |
7,885 |
|
Blocks with 5x5x20 |
7,435 |
|
Difference in % to B 10x10x20 |
5,7 % |
Table 9: Volume effect on averaged Ra
Although cuboidal blocks with dimensions of 10x10x20 are able to transfer the applied energy faster into the component, is the extended exposurelength a cause for an increased heat accumulation at the sides with a starting point (right hand side facing outwards) and on the inside. The reason for that is that overhanging parts of the layer poorly conduct the heat downwards. Table 10 shows the reason for the big differences of about 6% according to the separate sides.
|
Volume effect on averaged Ra [µm] per side |
||||
|
Side Block |
Outer Surf. |
Right |
Left |
Inner Surf. |
|
Blocks with 10x10x20 |
6,845 |
5,525 |
5,292 |
8,925 |
|
Blocks with 5x5x20 |
6,733 |
5,091 |
5,115 |
8,138 |
|
Difference in % to B 10x10x20 |
1,63 % |
7,85 % |
3,35 % |
8,83 % |
Table 10: Volume effect on average Ra per Surface
In order to determine the influence of the volume accurately, the averaged Ras of the entire test objects are itemized by the three measuring ranges. It turns out, that only slight variations, as a result of the first layer being built on loose powder, occurred. Therefore, sufficient material in the first third of the component is available to keep the heat accumulation on a low level.
|
Averaged Ra [µm] on different checkpoints |
|||
|
Checkpoints |
Bottom middle |
Side |
Top middle |
|
Mean surface roughness index |
6,3662 |
6,26 |
6,26 |
|
Percentaged deviation according to Bottom down measured area |
0 % |
2 % |
2 % |
Table 11: Averaged Ra on different checkpoints
In the context of this experiment, a lot of crucial influencing factors are identified to provide an acceptable surface roughness quality and process reliability.
Variations of the construction angle and cuboid volume show different connections between variable thermal conductivity effects of the solidified material and the loose powder by reference to the exposed area, the process based stair-stepping-effects and the resulting adhesion.
By analyzing the various experiments the impact of exposure and hatch strategies on the surface quality are shown.
Exposing the outer outline as a shaping element followed by exposing the surface is proven to be the most approperiate exposure strategy.
Considering the discussed hatch strategies, it becomes clear that two types of strategies are to be prefered in terms of surface quality and shape accuracy. The Stripes with Checkerboard strategy leads to satisfying results in all the crucial requirements. On the one hand, the strategy provides good heat dissipation during the exposure length while reducing the amount of adhesions. On the other hand, it provides minor geometrical deviations in combination with needing little time for the building process.
The Standard-Hatch and Random Checkerboard strategy generated only conditionally acceptable results. Because of the area-wide exposure from one side to another the Standard-Hatch strategy results in big differences between the roughnesses of the opposing sides. However, a very consistent surface on the last layer can be achieved which can be welcomed depending on the area of application. Exposing single areas in a random order, the Random Checkerboard strategy leads to large geometrical deviations.
The different combination of exposure- and hatch strategy, for building standard units of three big and two small cuboids, consisting of 857 layers, can result in a time difference of up to two hours.
This is a huge expenses factor and has to be considered depending on the requirements of the component.
Taking all into account, this experiment identifies important parameters for processing tool steel. Crucial connections are pointed out, enabling to design the construction phase according to the requirements of surface roughness, process safety and economic viability and giving a recommendation.
Practical recommendations can only be given in combination with the desired component geometry and the desired requirements.
For example, very small components or components with low demands on surface quality and shape accuracy should be produced using the hatch strategy Standard Hatch. Larger components with a high accuracy need should be produced using the hatch strategy Stripes with Checkerboard.
These examples are to point out the variety of possible combinations of strategies, which should be chosen according to the given results.
As this experiment showed, there are numerous parameters which in various cooperations, can influence the building process and the outcoming result significantly. Regardless of machine-specific restrictions, the findings can be transferred to other field of applications and provide tendencies for future developments.
The conducted experiments give practical recommendations and provide a basis for further research approaches.
For instance, further researches could be extended to the spectrum of the construction angle in order to give more specific propositions and recommendations in regard to the different combinations of strategies. Analyzing additional geometries, e.g. cones or pyramids, in different variations could provide propositions in terms of the construction angle and heat dissipation in combination with the available component’s mass.
Furthermore, the results of this paper showed that the exposure order can influence the component’s quality significantly. One idea, in order to achieve a satisfying result, could be to use the already solidified material to conduct the heat, preventing heat accumulation.
Another topic which could be established from this paper is to generate so-called heatgroups, which allow to automatically vary the laser parameters. At the moment, a fixed laser power is set, guarantying to fuse the exposed material. Depending on the conditions, e.g. loose powder or a low component volume, this can lead to negative effects. Heatgroups are meant to provide specific laser parameters according to the present conditions. Using this method the exposed surface is divided into single dots. Depending on their position and surrounding different laser parameters are assigned. This could counteract the set of problems caused by insufficient or exceeding laser power.
A numerical heat transfer analysis could strengthen the ideas displayed in this paper and support the experimental investigations.
[DEL-11] Delgado J. et al.,"Influence of process parameters on part quality and mechnanical properties for DMLS and SLM with iron-based materials", Springer, 2011
[FAT-12] Fateri, M. et al.: "Experimental and Theoretical Investigation of Buckling Deformation of Fabricated Objects by Selective Laser Melting", In Physics Procedia, 2012, Volume 39, Pages 464-470
[GEB-07] Gebhardt, Andreas: "Generative Fertigungsverfahren": 3.Auflage, München, Carl Hanser Verlag, 2007
[HOE-12] Hötter J, et al.: "Prozessoptimierung des SLM-Prozesses mit hoch-reflektiven und thermisch sehr gut leitenden Materialien durch systematische Parameterfindung und begleitende Simulationen am Beispiel von Silber". RTejournal - Forum für Rapid Technologie, Vol. 2012.
[KRA-13] Kraus H. et al. „Investigations on manufacturability and process reliability of
selective laser melting“, ScienceDirect, 2013
[KRU-03] Kruth, J.P. et al.: "Selective laser melting of iron-based powder", Journal of Materials Processing Technology, 2003
[REAc-12] Realizer GmbH: personal information
[SMU-07] Smurov. I. et al.: "Parametric analysis of the selective laser melting process", ScienceDirect, 2007
[STR-12] Strano,G. et al., "Surface Roughness analysis, modelling and prediction in selective laser melting", Journal of Materials Processing Technology, 2012
[YAS-09] Yasa, E. et al.,"Investigation of laser and process parameters for Selective Laser Erosion", Elsevier, 2009
[YAS-12] Yasa, E. et al.,"Microstructural investigation of Selective Laser Melting 316L stainless steel parts exposed to laser re-melting", ScienceDirect, 2012
Jan-Steffen Hötter, M. Eng.
Fachhochschule Aachen
Goethestraße 1
52062 Aachen
E-Mail:
hoetter@fh-aachen.de
Web:
http://www.fh-aachen.de/
Dawid Ziebura, B. Sc.
Fachhochschule Aachen
Goethestraße 1
52062 Aachen
E-Mail:
ziebura@fh-aachen.de
Web:
http://www.fh-aachen.de/
Prof. Dr.-Ing. Andreas Gebhardt.
Fachhochschule Aachen
Goethestraße 1
52062 Aachen
E-Mail:
gehardt@fh-aachen.de
Web:
http://www.fh-aachen.de/